Markets
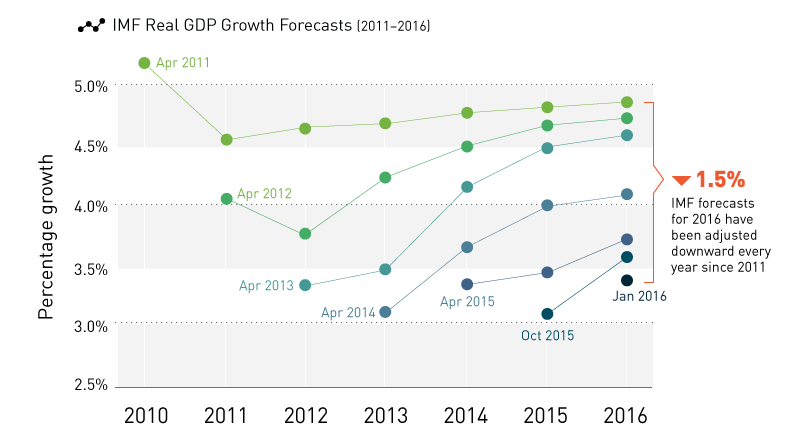
IMF Growth Forecasts: Missing the Mark So Far [Chart]
![IMF Growth Forecasts: Missing the Mark So Far [Chart]](https://www.visualcapitalist.com/wp-content/uploads/2016/04/imf-chart-forecasts.png)
IMF Growth Forecasts: Missing the Mark So Far [Chart]
Will next week’s report be on target after 5 years of downward revisions?
The Chart of the Week is a weekly Visual Capitalist feature on Fridays.
Projections on the global economic recovery have been overestimated by most policymakers and institutions for some time now. The International Monetary Fund (IMF) has been no exception to this fallacy.
Whether it is simple error, wishful thinking, or a complex system that is to blame, the economists at the IMF have now missed the mark for five years in a row on their global real GDP growth forecasts. After multiple revisions downward, their most recent January 2016 report finally estimated growth for this year to be a mediocre 3.4%.
Of course, no one expects economists to be anywhere near perfect. However, what is troubling in this instance is that all estimates have erred on the side of being overly optimistic. This makes it difficult for investors, businesses, and governments to ground their expectations and to manage their assets.
Frontrunning
This upcoming week, the IMF will release their latest World Economic Outlook (WEO) report, summarizing key economic figures as well as their forecasted growth for 2016 and the years ahead.
Will they miss the mark again, or will their projections finally line up with economic realities?
In recent weeks, IMF head Christine Lagarde has hit the press circuit to possibly set expectations ahead of the new report’s release. In Frankfurt, she had this to say on April 5, potentially revealing some clues for us:
Overall, the global outlook has weakened further over the last six months — exacerbated by China’s relative slowdown, lower commodity prices, and the prospect of financial tightening for many countries. Emerging markets had largely driven the recovery and the expectation was that the advanced economies would pick up the ‘growth baton’ – That has not happened.
She went on to suggest that a strong U.S. dollar, high unemployment and shoddy balance sheets in Europe, and economic data from Japan have all reduced growth in key developed countries. Further, emerging markets such as China, Brazil, and Russia had all faced more challenges than expected, and that the Middle East’s growth got hammered by weak energy prices.
Meanwhile, Lagarde saw India, Indonesia, Malaysia, Philippines, Thailand, and Vietnam as bright spots.
Later in the speech, she pulled no punches on potential global risks, mentioning “high debt” as the first risk to making recovery progress:
For advanced economies, [risks] relate to longstanding crisis legacies — high debt, low inflation, low investment, low productivity, and, for some, high unemployment.
While Lagarde made it clear that there has been a “loss of momentum” and that the IMF is “on alert, not alarm”, this could be a clue that the reality is setting in for the IMF: a sustained, real recovery is not in the cards unless giant obstacles are overcome. We believe this could take a prolonged time to truly correct, or that it could eventually happen after a major reset to our financial and political systems.
Either way, for once it seems possible (though improbable), that the IMF may finally see things the same way.


Markets
The Best U.S. Companies to Work for According to LinkedIn
We visualized the results of a LinkedIn study on the best U.S. companies to work for in 2024.
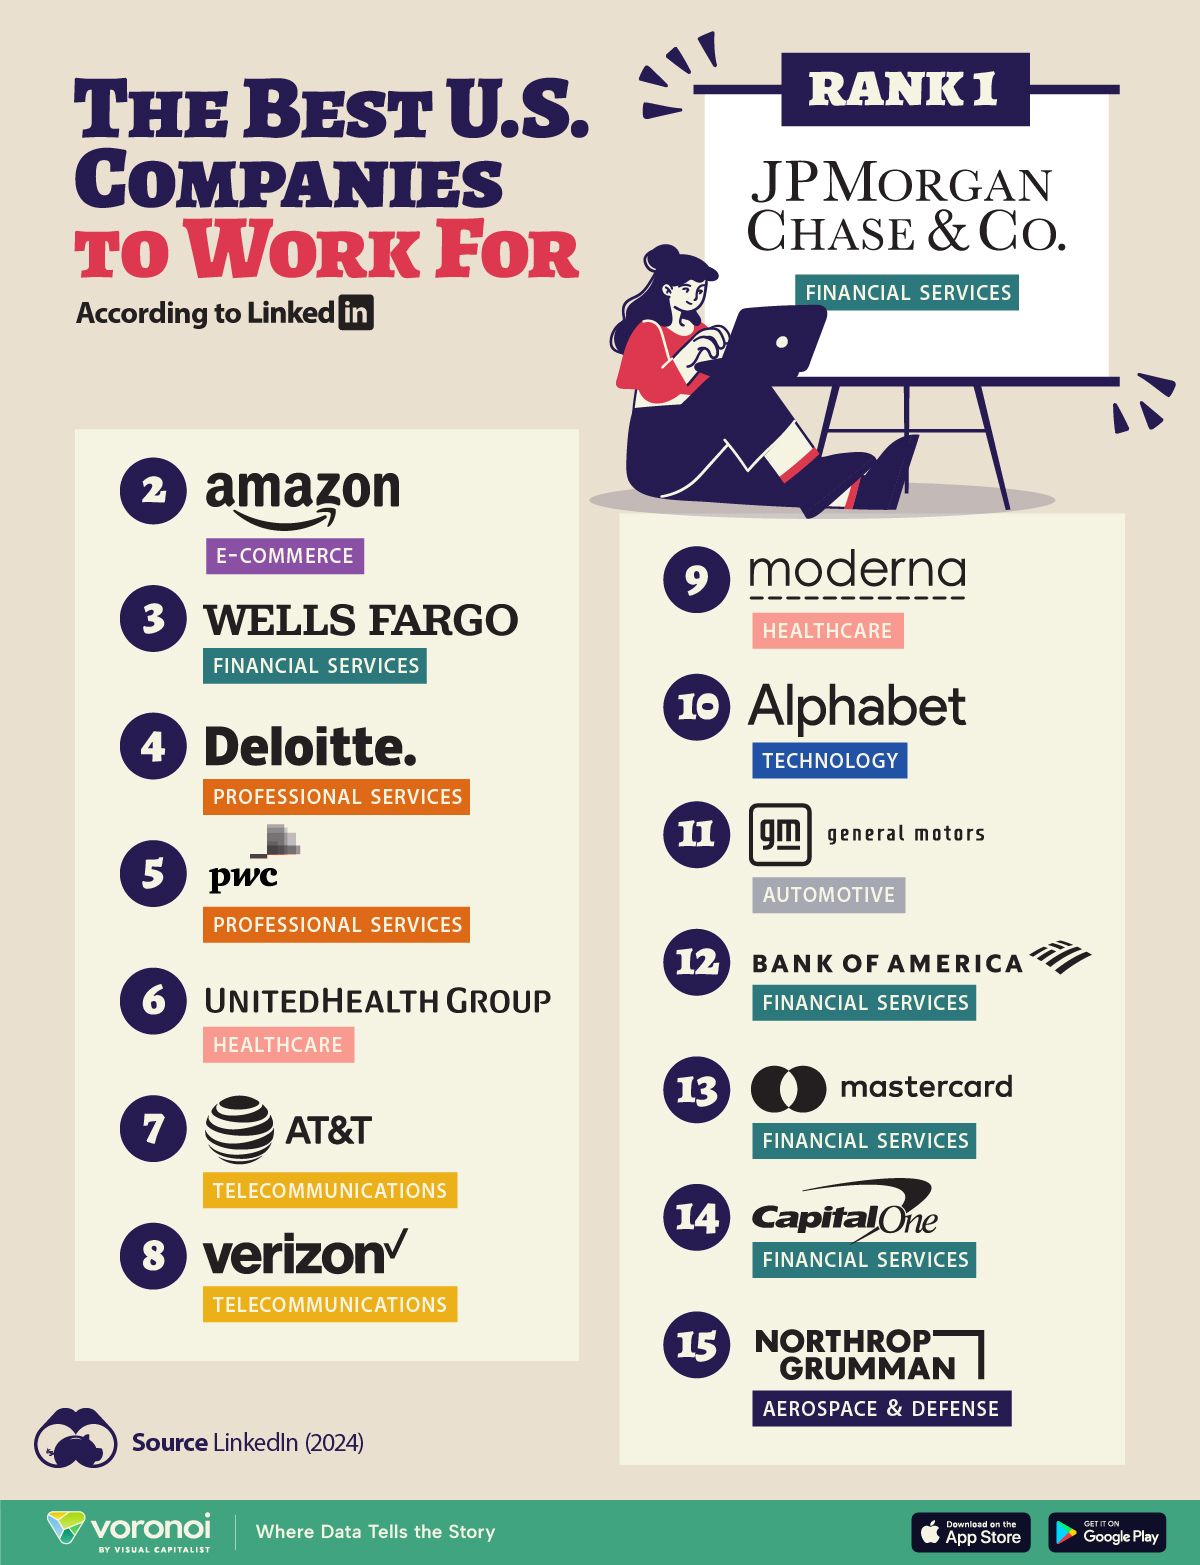
The Best U.S. Companies to Work for According to LinkedIn
This was originally posted on our Voronoi app. Download the app for free on iOS or Android and discover incredible data-driven charts from a variety of trusted sources.
In this graphic, we list the 15 best U.S. companies to work for in 2024, according to LinkedIn data.
LinkedIn ranked companies based on eight pillars: ability to advance, skills growth, company stability, external opportunity, company affinity, gender diversity, educational background, and employee presence in the country.
To be eligible, companies must have had 5,000 or more global employees, with at least 500 in the country as of December 31, 2023.
Data and Highlights
Financial institutions dominate the ranking of the best U.S. companies to work for in 2024, with JP Morgan Chase & Co. ranking first.
| Rank | Company | Industry |
|---|---|---|
| 1 | JP Morgan Chase & Co. | Financial Services |
| 2 | Amazon | E-commerce |
| 3 | Wells Fargo | Financial Services |
| 4 | Deloitte | Professional Services |
| 5 | PwC | Professional Services |
| 6 | UnitedHealth Group | Healthcare |
| 7 | AT&T | Telecommunications |
| 8 | Verizon | Telecommunications |
| 9 | Moderna | Pharmaceuticals |
| 10 | Alphabet Inc. | Technology |
| 11 | General Motors | Automotive |
| 12 | Bank of America | Financial Services |
| 13 | Mastercard | Financial Services |
| 14 | Capital One | Financial Services |
| 15 | Northrop Grumman | Aerospace & Defense |
J.P. Morgan has a program that offers opportunities for candidates without a university degree. In fact, in 2022, 75% of job descriptions at the bank for experienced hires did not require a college degree.
Meanwhile, Deloitte and Amazon offer a variety of free training courses, including in AI.
Moderna includes in its employee package benefits to help avoid employee burnout — from subsidized commuter expenses and pop-up daycare centers, to wellness coaches.
Mastercard offers flexible work availability, with 11.5% remote and 89% hybrid options.
It’s also interesting to note that only Amazon and Alphabet made the cut from the ‘Magnificent Seven’ companies (Apple, Microsoft, Google parent Alphabet, Amazon, Nvidia, Meta Platforms, and Tesla).
See more about the best companies to work for in this infographic, which covers a separate ranking from Glassdoor.

-

 Technology7 days ago
Visualizing AI Patents by Country
-

 Green2 weeks ago
Ranking the Top 15 Countries by Carbon Tax Revenue
-

 Markets2 weeks ago
U.S. Debt Interest Payments Reach $1 Trillion
-

 Mining2 weeks ago
Gold vs. S&P 500: Which Has Grown More Over Five Years?
-

 Uranium2 weeks ago
The World’s Biggest Nuclear Energy Producers
-

 Misc2 weeks ago
How Hard Is It to Get Into an Ivy League School?
-

 Debt2 weeks ago
How Debt-to-GDP Ratios Have Changed Since 2000
-

 Culture2 weeks ago
The Highest Earning Athletes in Seven Professional Sports