Markets
Video: The History of Credit Cards
Today, credit cards are one of the most important sources of big bank profits. However, a look at the history of credit cards shows that things weren’t always that way.
The History of Credit Cards
While it may seem today that credit is impersonal and calculated, credit was once a privilege built around personal trust and long-lasting relationships. In the late 19th century, stores began offering credit to their best and most trustworthy customers. Instead of paying each time they visited the shop, a regular could defer payments to the future by using store-issued metal coins or plates that had their account number engraved. Shops would record the purchase details, and add the cost of the item bought to the customer’s balance owed.
By the 1920s, shops started issuing paper cards instead of metal plates, but even these became cumbersome. Consumers had to hold different cards for each shop, and this made the sector ripe for disruption.
Diners Club, the first independent credit card company in the world, did just that in the 1950s. Their cards allowed people to make travel and entertainment purchases, even with different vendors.
Bank of America took this idea and ran with it, forever changing the history of credit cards. They launched the “BankAmericard” in Fresno, California, by sending it out to all 60,000 residents at once. Soon all consumers and vendors in the city were using the same card, and the concept of mass-mailing cards to the public spread like a wildfire.
After these risky mass mailings of credit cards eventually culminated in the Chicago Debacle of 1966, they were outlawed in the 1970s for causing “financial chaos”. With no applications required, many people including compulsive debtors, crooks, and narcotics addicts were able to receive easy credit. By the time such mass airdrops became illegal, 100 million cards had already been unleashed on the U.S. population without a need for an application.
In 1976, the BankAmericard system eventually became Visa. It was soon after this point that credit cards would enter their golden age for banks: as savings rates fell in the early 1980s, the interest rates on debt did not. Credit cards became a “cash cow”, and they’ve been a key source of bank profits ever since.
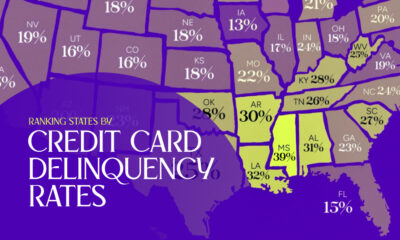
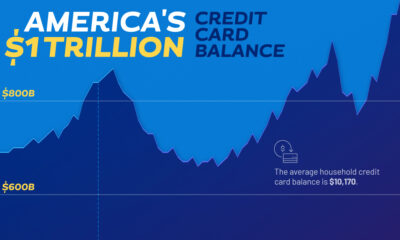
Today, 80% of U.S. households own multiple cards, and they account for just under $1 trillion of consumer debt.
Original video by: &Orange


Markets
U.S. Debt Interest Payments Reach $1 Trillion
U.S. debt interest payments have surged past the $1 trillion dollar mark, amid high interest rates and an ever-expanding debt burden.


U.S. Debt Interest Payments Reach $1 Trillion
This was originally posted on our Voronoi app. Download the app for free on iOS or Android and discover incredible data-driven charts from a variety of trusted sources.
The cost of paying for America’s national debt crossed the $1 trillion dollar mark in 2023, driven by high interest rates and a record $34 trillion mountain of debt.
Over the last decade, U.S. debt interest payments have more than doubled amid vast government spending during the pandemic crisis. As debt payments continue to soar, the Congressional Budget Office (CBO) reported that debt servicing costs surpassed defense spending for the first time ever this year.
This graphic shows the sharp rise in U.S. debt payments, based on data from the Federal Reserve.
A $1 Trillion Interest Bill, and Growing
Below, we show how U.S. debt interest payments have risen at a faster pace than at another time in modern history:
| Date | Interest Payments | U.S. National Debt |
|---|---|---|
| 2023 | $1.0T | $34.0T |
| 2022 | $830B | $31.4T |
| 2021 | $612B | $29.6T |
| 2020 | $518B | $27.7T |
| 2019 | $564B | $23.2T |
| 2018 | $571B | $22.0T |
| 2017 | $493B | $20.5T |
| 2016 | $460B | $20.0T |
| 2015 | $435B | $18.9T |
| 2014 | $442B | $18.1T |
| 2013 | $425B | $17.2T |
| 2012 | $417B | $16.4T |
| 2011 | $433B | $15.2T |
| 2010 | $400B | $14.0T |
| 2009 | $354B | $12.3T |
| 2008 | $380B | $10.7T |
| 2007 | $414B | $9.2T |
| 2006 | $387B | $8.7T |
| 2005 | $355B | $8.2T |
| 2004 | $318B | $7.6T |
| 2003 | $294B | $7.0T |
| 2002 | $298B | $6.4T |
| 2001 | $318B | $5.9T |
| 2000 | $353B | $5.7T |
| 1999 | $353B | $5.8T |
| 1998 | $360B | $5.6T |
| 1997 | $368B | $5.5T |
| 1996 | $362B | $5.3T |
| 1995 | $357B | $5.0T |
| 1994 | $334B | $4.8T |
| 1993 | $311B | $4.5T |
| 1992 | $306B | $4.2T |
| 1991 | $308B | $3.8T |
| 1990 | $298B | $3.4T |
| 1989 | $275B | $3.0T |
| 1988 | $254B | $2.7T |
| 1987 | $240B | $2.4T |
| 1986 | $225B | $2.2T |
| 1985 | $219B | $1.9T |
| 1984 | $205B | $1.7T |
| 1983 | $176B | $1.4T |
| 1982 | $157B | $1.2T |
| 1981 | $142B | $1.0T |
| 1980 | $113B | $930.2B |
| 1979 | $96B | $845.1B |
| 1978 | $84B | $789.2B |
| 1977 | $69B | $718.9B |
| 1976 | $61B | $653.5B |
| 1975 | $55B | $576.6B |
| 1974 | $50B | $492.7B |
| 1973 | $45B | $469.1B |
| 1972 | $39B | $448.5B |
| 1971 | $36B | $424.1B |
| 1970 | $35B | $389.2B |
| 1969 | $30B | $368.2B |
| 1968 | $25B | $358.0B |
| 1967 | $23B | $344.7B |
| 1966 | $21B | $329.3B |
Interest payments represent seasonally adjusted annual rate at the end of Q4.
At current rates, the U.S. national debt is growing by a remarkable $1 trillion about every 100 days, equal to roughly $3.6 trillion per year.
As the national debt has ballooned, debt payments even exceeded Medicaid outlays in 2023—one of the government’s largest expenditures. On average, the U.S. spent more than $2 billion per day on interest costs last year. Going further, the U.S. government is projected to spend a historic $12.4 trillion on interest payments over the next decade, averaging about $37,100 per American.
Exacerbating matters is that the U.S. is running a steep deficit, which stood at $1.1 trillion for the first six months of fiscal 2024. This has accelerated due to the 43% increase in debt servicing costs along with a $31 billion dollar increase in defense spending from a year earlier. Additionally, a $30 billion increase in funding for the Federal Deposit Insurance Corporation in light of the regional banking crisis last year was a major contributor to the deficit increase.
Overall, the CBO forecasts that roughly 75% of the federal deficit’s increase will be due to interest costs by 2034.

-

 Maps2 weeks ago
Mapped: Average Wages Across Europe
-

 Money1 week ago
Which States Have the Highest Minimum Wage in America?
-

 Real Estate1 week ago
Ranked: The Most Valuable Housing Markets in America
-

 Markets1 week ago
Charted: Big Four Market Share by S&P 500 Audits
-

 AI1 week ago
The Stock Performance of U.S. Chipmakers So Far in 2024
-

 Automotive2 weeks ago
Almost Every EV Stock is Down After Q1 2024
-

 Money2 weeks ago
Where Does One U.S. Tax Dollar Go?
-

 Green2 weeks ago
Ranked: Top Countries by Total Forest Loss Since 2001