Markets
The Salary Needed to Buy a Home in 27 Different U.S. Cities
Check out the latest 2023 update of the salary needed to buy a home in the U.S.
The Salary Needed to Buy a Home in 27 Different U.S. Cities
Check out the latest 2023 update of the salary needed to buy a home in the U.S.
The popping of the Greenspan-era housing bubble took about six years in total to fully “deflate”.
Most U.S. housing markets peaked sometime in 2006, and it wouldn’t be until just before the third-round of quantitative easing in 2012 that this fall would finally be cushioned. Since then, the combination of QE and record-low interest rates have helped re-inflate the housing market. For better or worse, real estate in many U.S. cities are now approaching or passing their 2006 housing highs, but with a growing disparity between individual metropolitan areas.
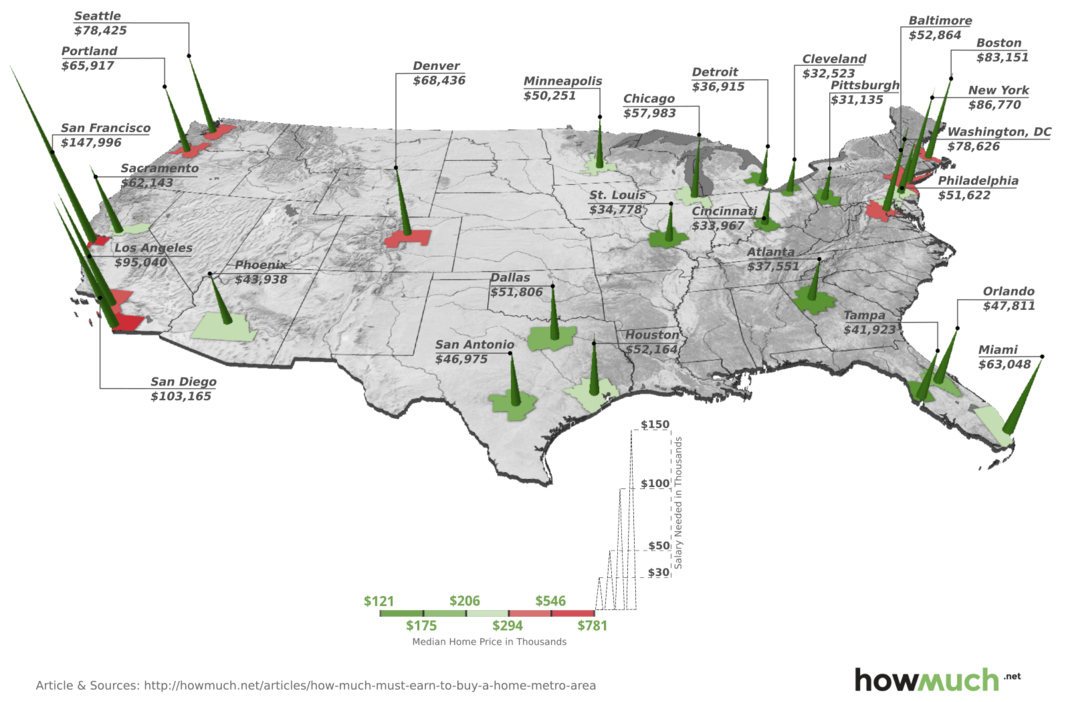
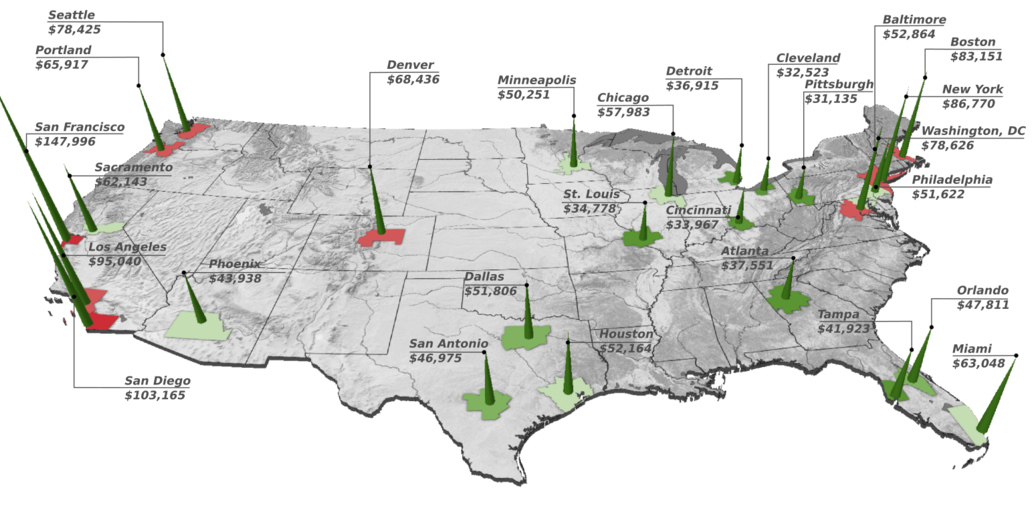
Today’s 3D map comes to us from HowMuch.net, and it shows the very different salaries needed to buy a median home in 27 different U.S. metropolitan areas. The salaries range between $31,134 to $147,996, which is a discrepancy of over $100,000.
At the low end of the spectrum, it takes a salary of between $30,000 to $40,000 to buy a home in most metropolitan areas in the Midwest. In St. Louis, for example, the salary needed to buy a home is $34,778. Pittsburgh was the least expensive city analyzed, where a salary of $31,135 could buy the median house in the city.
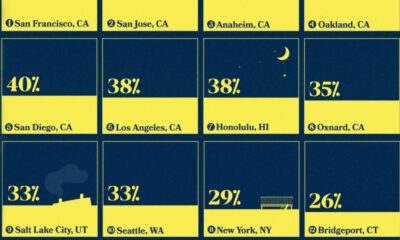
At the high end is any metropolitan area in California, for which closer to six figures is now needed. San Francisco has the most expensive housing in the country, where residents must make $147,996 a year to be an average homeowner. However, Southern California is not far behind the Bay Area, where salaries of $95,040 and $103,165 are required to buy in Los Angeles and San Diego respectively.
See the full data set, including mortgage rates, monthly payments, and median house prices here.
West Coast Envy
Which cities have rebounded the most since the popping of the housing bubble?
According to The Economist’s interactive chart on U.S. housing price indices, the average U.S. market recovery between 2006 peak and 2012 trough has been about 63.9%.
The Eastern half of the country has struggled to rebound to 2006 housing highs, with New York City, Baltimore, Philadelphia, Chicago, Tampa, Miami, and St. Louis all recovering below the above average mark.
In contrast, prices in the West are soaring: San Francisco, Houston, Dallas, Denver, and Portland have all met or exceeded their 2006 highs. Meanwhile, Los Angeles, Seattle, and San Diego have recovered better than average.


Markets
U.S. Debt Interest Payments Reach $1 Trillion
U.S. debt interest payments have surged past the $1 trillion dollar mark, amid high interest rates and an ever-expanding debt burden.


U.S. Debt Interest Payments Reach $1 Trillion
This was originally posted on our Voronoi app. Download the app for free on iOS or Android and discover incredible data-driven charts from a variety of trusted sources.
The cost of paying for America’s national debt crossed the $1 trillion dollar mark in 2023, driven by high interest rates and a record $34 trillion mountain of debt.
Over the last decade, U.S. debt interest payments have more than doubled amid vast government spending during the pandemic crisis. As debt payments continue to soar, the Congressional Budget Office (CBO) reported that debt servicing costs surpassed defense spending for the first time ever this year.
This graphic shows the sharp rise in U.S. debt payments, based on data from the Federal Reserve.
A $1 Trillion Interest Bill, and Growing
Below, we show how U.S. debt interest payments have risen at a faster pace than at another time in modern history:
| Date | Interest Payments | U.S. National Debt |
|---|---|---|
| 2023 | $1.0T | $34.0T |
| 2022 | $830B | $31.4T |
| 2021 | $612B | $29.6T |
| 2020 | $518B | $27.7T |
| 2019 | $564B | $23.2T |
| 2018 | $571B | $22.0T |
| 2017 | $493B | $20.5T |
| 2016 | $460B | $20.0T |
| 2015 | $435B | $18.9T |
| 2014 | $442B | $18.1T |
| 2013 | $425B | $17.2T |
| 2012 | $417B | $16.4T |
| 2011 | $433B | $15.2T |
| 2010 | $400B | $14.0T |
| 2009 | $354B | $12.3T |
| 2008 | $380B | $10.7T |
| 2007 | $414B | $9.2T |
| 2006 | $387B | $8.7T |
| 2005 | $355B | $8.2T |
| 2004 | $318B | $7.6T |
| 2003 | $294B | $7.0T |
| 2002 | $298B | $6.4T |
| 2001 | $318B | $5.9T |
| 2000 | $353B | $5.7T |
| 1999 | $353B | $5.8T |
| 1998 | $360B | $5.6T |
| 1997 | $368B | $5.5T |
| 1996 | $362B | $5.3T |
| 1995 | $357B | $5.0T |
| 1994 | $334B | $4.8T |
| 1993 | $311B | $4.5T |
| 1992 | $306B | $4.2T |
| 1991 | $308B | $3.8T |
| 1990 | $298B | $3.4T |
| 1989 | $275B | $3.0T |
| 1988 | $254B | $2.7T |
| 1987 | $240B | $2.4T |
| 1986 | $225B | $2.2T |
| 1985 | $219B | $1.9T |
| 1984 | $205B | $1.7T |
| 1983 | $176B | $1.4T |
| 1982 | $157B | $1.2T |
| 1981 | $142B | $1.0T |
| 1980 | $113B | $930.2B |
| 1979 | $96B | $845.1B |
| 1978 | $84B | $789.2B |
| 1977 | $69B | $718.9B |
| 1976 | $61B | $653.5B |
| 1975 | $55B | $576.6B |
| 1974 | $50B | $492.7B |
| 1973 | $45B | $469.1B |
| 1972 | $39B | $448.5B |
| 1971 | $36B | $424.1B |
| 1970 | $35B | $389.2B |
| 1969 | $30B | $368.2B |
| 1968 | $25B | $358.0B |
| 1967 | $23B | $344.7B |
| 1966 | $21B | $329.3B |
Interest payments represent seasonally adjusted annual rate at the end of Q4.
At current rates, the U.S. national debt is growing by a remarkable $1 trillion about every 100 days, equal to roughly $3.6 trillion per year.
As the national debt has ballooned, debt payments even exceeded Medicaid outlays in 2023—one of the government’s largest expenditures. On average, the U.S. spent more than $2 billion per day on interest costs last year. Going further, the U.S. government is projected to spend a historic $12.4 trillion on interest payments over the next decade, averaging about $37,100 per American.
Exacerbating matters is that the U.S. is running a steep deficit, which stood at $1.1 trillion for the first six months of fiscal 2024. This has accelerated due to the 43% increase in debt servicing costs along with a $31 billion dollar increase in defense spending from a year earlier. Additionally, a $30 billion increase in funding for the Federal Deposit Insurance Corporation in light of the regional banking crisis last year was a major contributor to the deficit increase.
Overall, the CBO forecasts that roughly 75% of the federal deficit’s increase will be due to interest costs by 2034.

-

 Mining2 weeks ago
Charted: The Value Gap Between the Gold Price and Gold Miners
-

 Real Estate1 week ago
Ranked: The Most Valuable Housing Markets in America
-

 Business1 week ago
Charted: Big Four Market Share by S&P 500 Audits
-

 AI1 week ago
The Stock Performance of U.S. Chipmakers So Far in 2024
-

 Misc1 week ago
Almost Every EV Stock is Down After Q1 2024
-

 Money2 weeks ago
Where Does One U.S. Tax Dollar Go?
-

 Green2 weeks ago
Ranked: Top Countries by Total Forest Loss Since 2001
-

 Real Estate2 weeks ago
Visualizing America’s Shortage of Affordable Homes