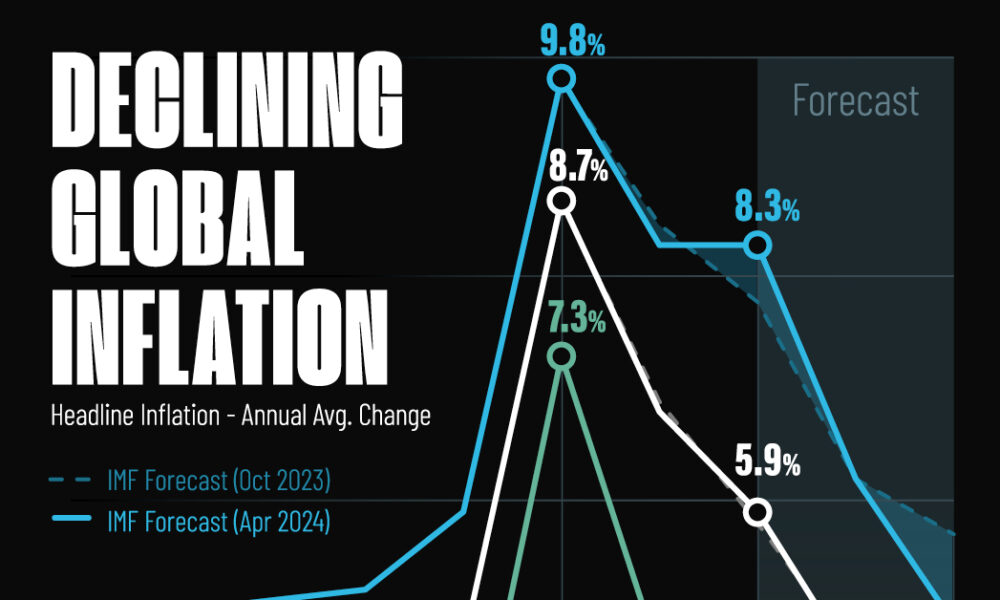
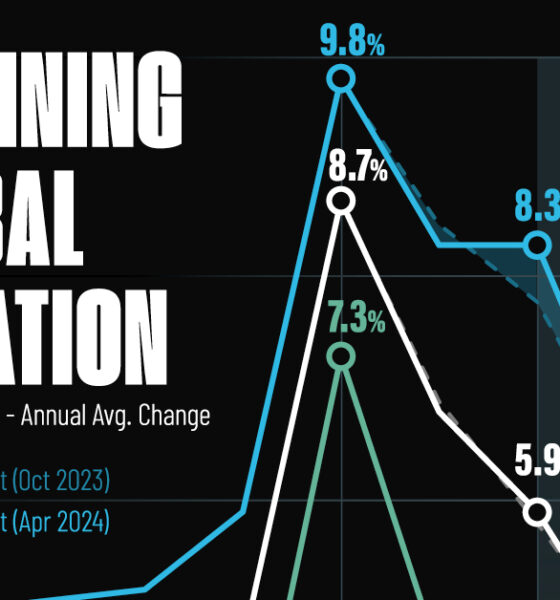
Here are IMF forecasts for global inflation rates up to 2026, highlighting a slow descent of price pressures amid resilient...
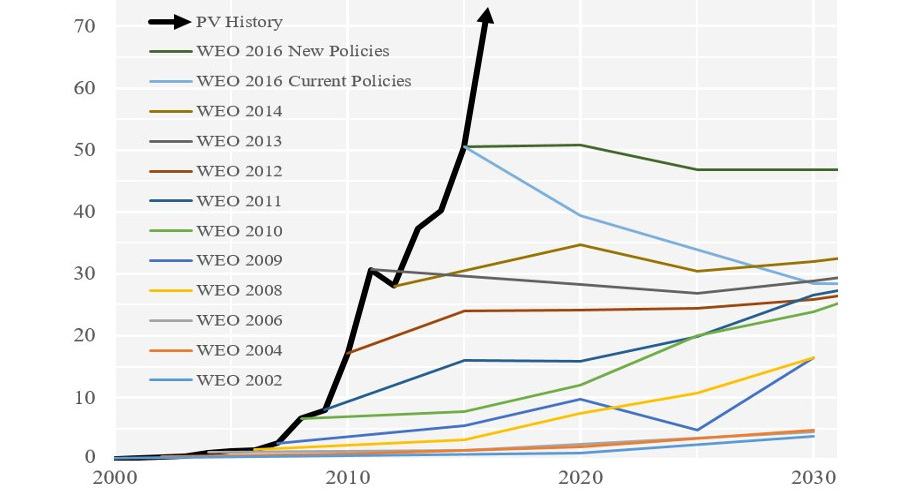
Forecasting the future of energy is not an easy task. These charts show how the experts have fared at forecasting solar over recent decades.
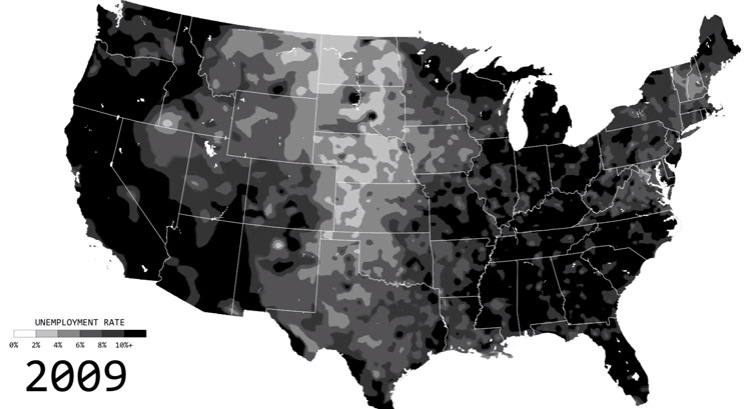
See the ebbs and flows of regional unemployment in the United States in this animated map from 1990 until 2016.
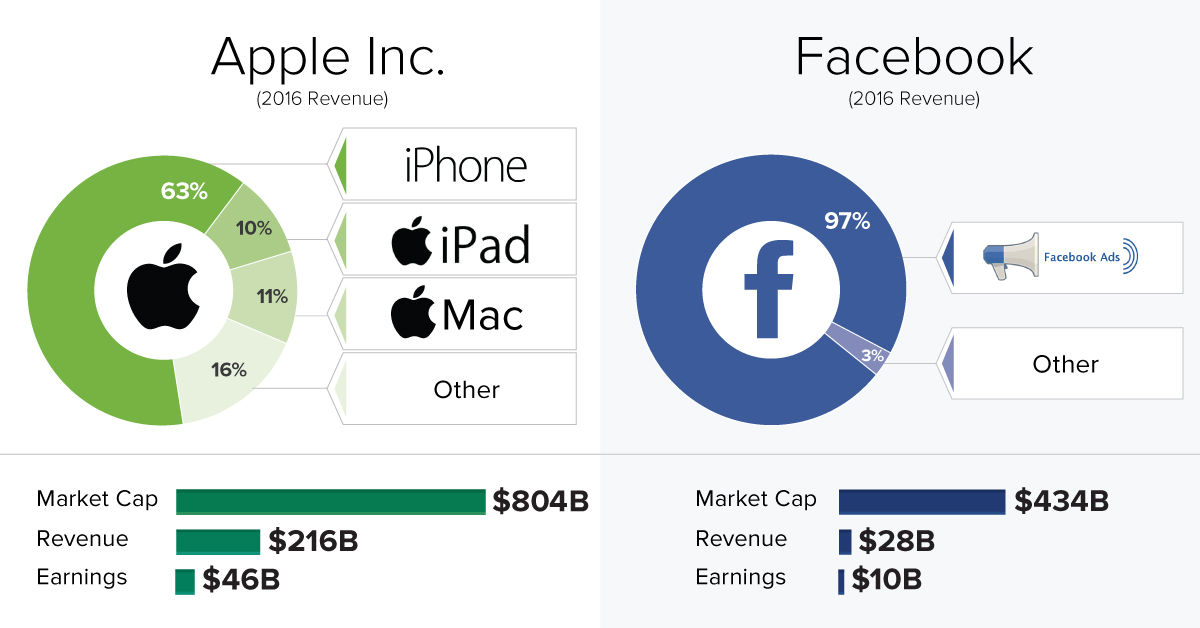
These five companies combined for $555 billion in revenues in 2016 - here's a breakdown of each company's revenue by product or service category.
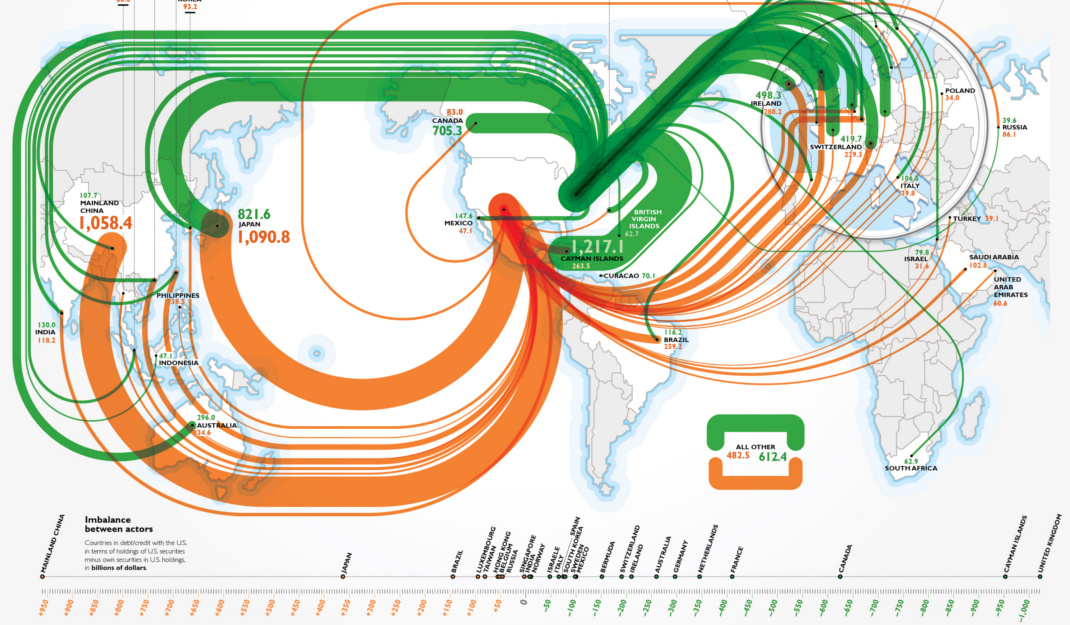
Ever wonder who holds U.S. debt abroad? This infographic shows foreign holders of U.S. treasuries, as well as the debt from other countries held by U.S.
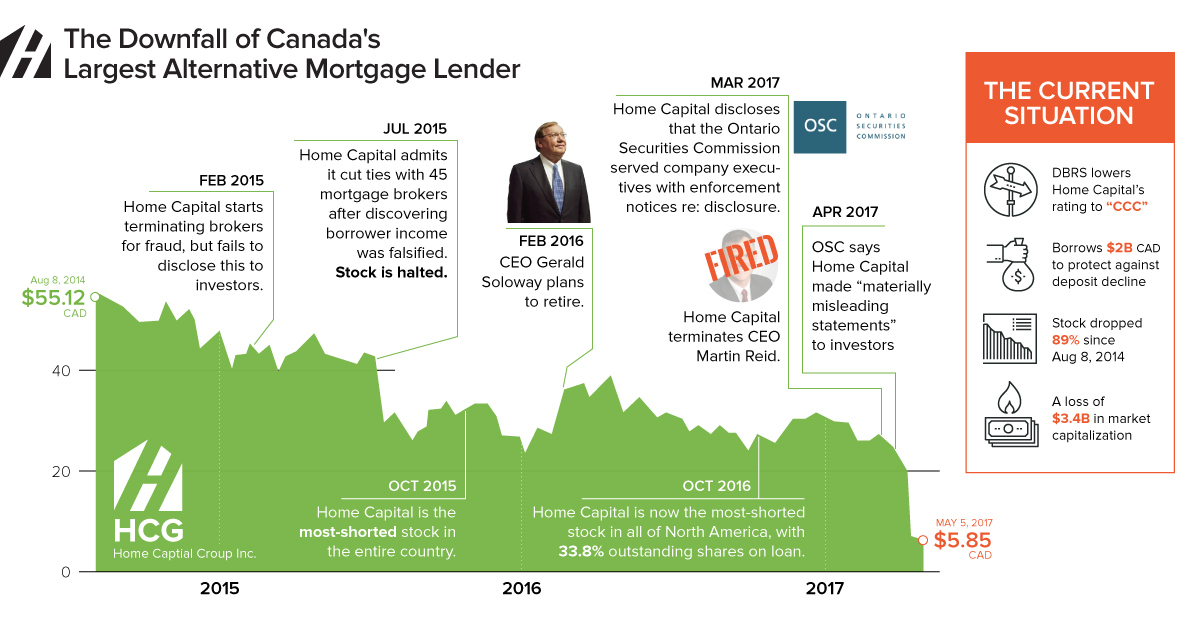
The events leading to the downfall of Home Capital, which is Canada's largest alternative mortgage lender - and what it could mean for global investors.
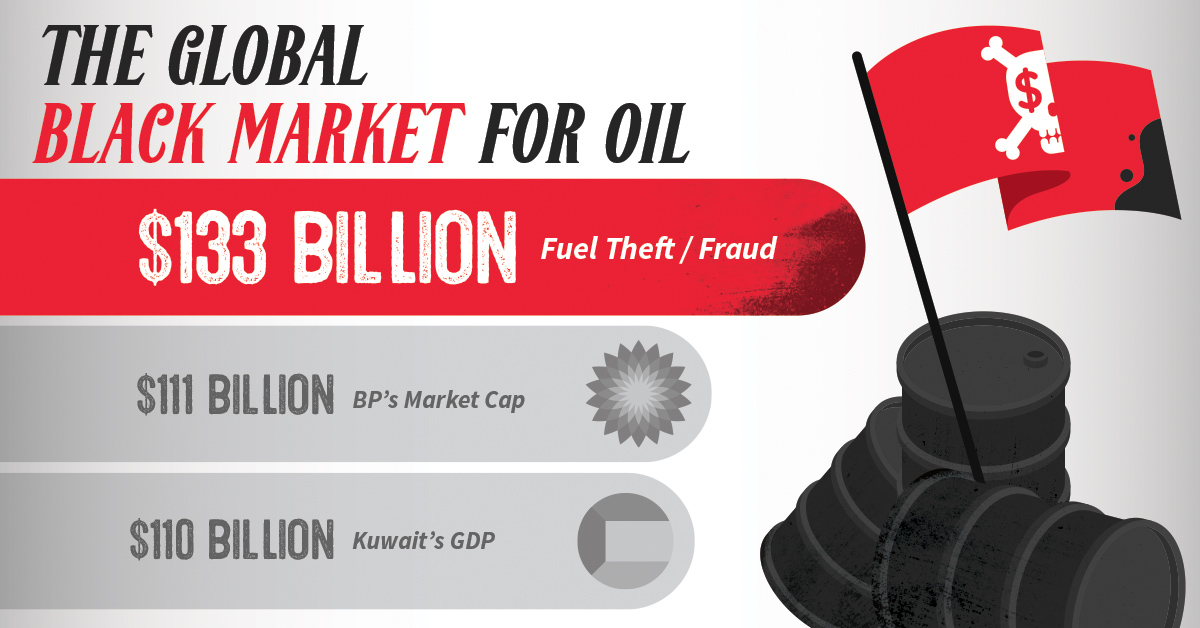
Oil is a money maker, but it's also lucrative for criminals and terrorists. Every year, $133B is lost to fuel theft - here's how it happens...
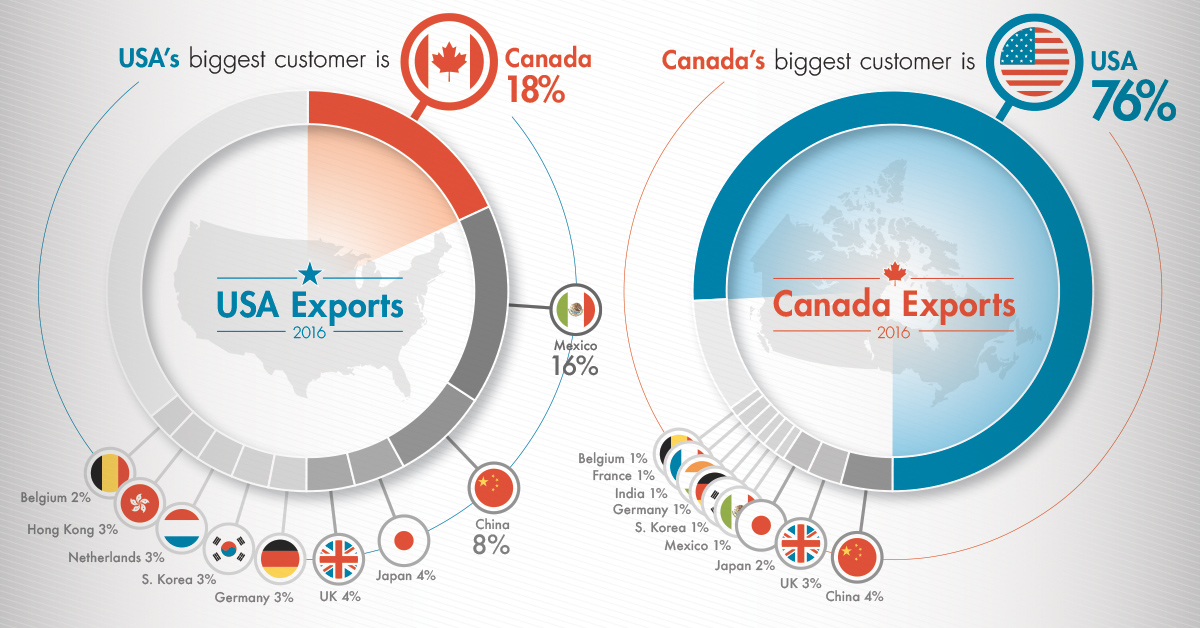
Key facts and numbers behind the historic USA-Canada trade relationship, in which a staggering $1.7B in goods are exchanged per day.
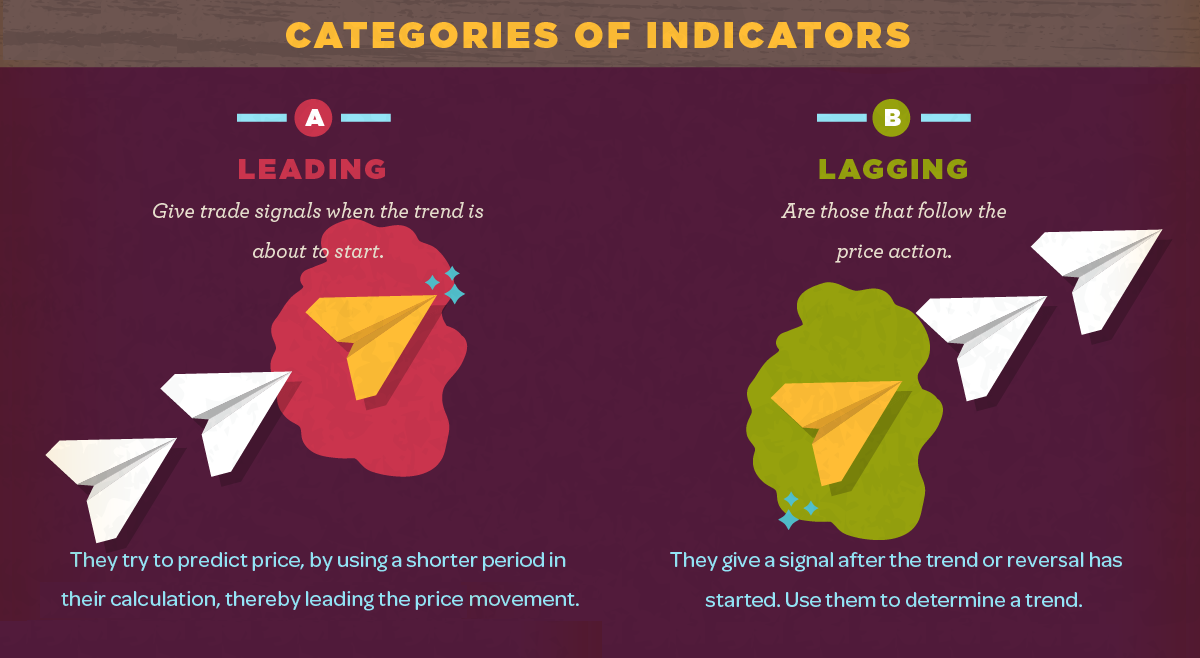
Many professional stock traders use technical indicators to help them with trade timing or to alert them of new trends. Here's what they are all about.
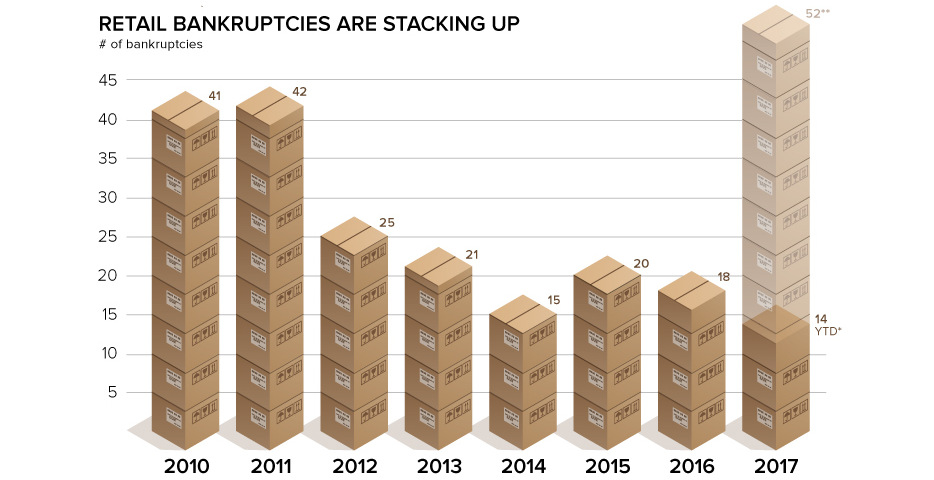
Retail chains are going bankrupt, and thousands of stores are shuttering their doors. It's the retail apocalypse - and here's what you should know about it.
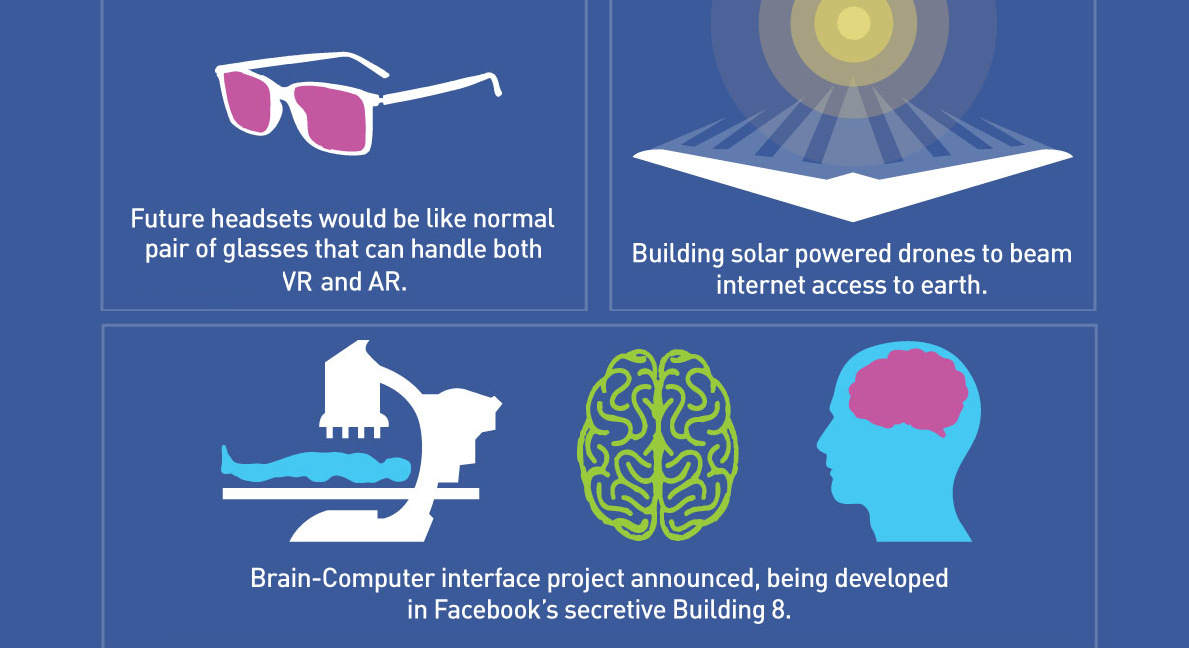
Here are the technologies that Facebook is working on to try and transform the company into a $1 trillion behemoth over the next 10 years.


