Technology
The Progress of Facebook’s 10-Year Masterplan

The Details of Facebook’s 10-Year Masterplan
In the company’s first 10 years, Mark Zuckerberg transformed Facebook from a college side-project into a multi-billion dollar platform.
Along the way, Zuckerberg was given many opportunities to exit. He was offered $75 million from Viacom in the very early days, and then $1.5 billion later on (including $800 million cash up front). Yahoo also missed out on making a deal after having its $1 billion offer rejected in 2006.
Zucks kept to his guns, even despite significant pressure to sell. As Peter Thiel recounts, Zuckerberg didn’t know what he’d do with the money, and would likely just start another social networking site anyways.
Given his vision for Facebook and an obvious passion for connecting people, it’s not surprising to learn that over the next 10 years, Zuckerberg plans to execute just as ambitiously.
Facebook’s Masterplan
Today’s infographic comes from Futurism, and it details Facebook’s masterplan to potentially make the company a $1 trillion colossus. It’s worth noting that Facebook is technically already about one year into the 10-year plan, and that the infographic has been updated to include the latest developments in the company as of 2017.
Here are the ambitious plans that the company hopes to bring to a reality:
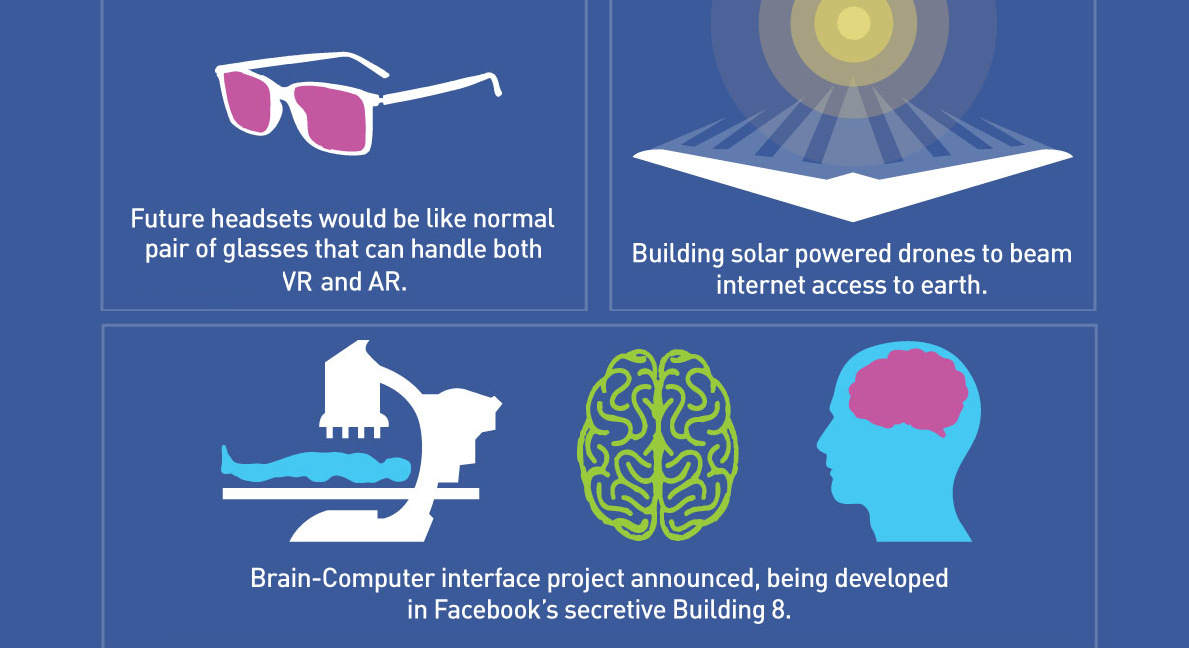
- Use solar-powered drones to beam internet access to Earth.
- Build hardware that will boost internet connectivity in dense urban areas.
- Launch a satellite to help provide internet access to Africa.
- Enable artificial intelligence to learn about content. (ie. what a video or image is all about.)
- Train neural networks through Facebook’s open source Torch system.
- Build VR/AR headsets that look like a normal pair of glasses.
- Work on new social experiences using virtual reality as a social platform.
- Continued development of the Brain-Computer interface project to allow users to “type” with their thoughts.
The latter of these plans was just announced just last week, and it involves a team of 60 engineers working to find a way to translate your thoughts into Facebook updates.
Using non-invasive optical imaging to scan your brain a hundred times per second, eventually the goal is to allow people to “type” at 100 words per minute, a 5x increase over normal phone typing speeds.


Technology
All of the Grants Given by the U.S. CHIPS Act
Intel, TSMC, and more have received billions in subsidies from the U.S. CHIPS Act in 2024.


All of the Grants Given by the U.S. CHIPS Act
This was originally posted on our Voronoi app. Download the app for free on iOS or Android and discover incredible data-driven charts from a variety of trusted sources.
This visualization shows which companies are receiving grants from the U.S. CHIPS Act, as of April 25, 2024. The CHIPS Act is a federal statute signed into law by President Joe Biden that authorizes $280 billion in new funding to boost domestic research and manufacturing of semiconductors.
The grant amounts visualized in this graphic are intended to accelerate the production of semiconductor fabrication plants (fabs) across the United States.
Data and Company Highlights
The figures we used to create this graphic were collected from a variety of public news sources. The Semiconductor Industry Association (SIA) also maintains a tracker for CHIPS Act recipients, though at the time of writing it does not have the latest details for Micron.
| Company | Federal Grant Amount | Anticipated Investment From Company |
|---|---|---|
| 🇺🇸 Intel | $8,500,000,000 | $100,000,000,000 |
| 🇹🇼 TSMC | $6,600,000,000 | $65,000,000,000 |
| 🇰🇷 Samsung | $6,400,000,000 | $45,000,000,000 |
| 🇺🇸 Micron | $6,100,000,000 | $50,000,000,000 |
| 🇺🇸 GlobalFoundries | $1,500,000,000 | $12,000,000,000 |
| 🇺🇸 Microchip | $162,000,000 | N/A |
| 🇬🇧 BAE Systems | $35,000,000 | N/A |
BAE Systems was not included in the graphic due to size limitations
Intel’s Massive Plans
Intel is receiving the largest share of the pie, with $8.5 billion in grants (plus an additional $11 billion in government loans). This grant accounts for 22% of the CHIPS Act’s total subsidies for chip production.
From Intel’s side, the company is expected to invest $100 billion to construct new fabs in Arizona and Ohio, while modernizing and/or expanding existing fabs in Oregon and New Mexico. Intel could also claim another $25 billion in credits through the U.S. Treasury Department’s Investment Tax Credit.
TSMC Expands its U.S. Presence
TSMC, the world’s largest semiconductor foundry company, is receiving a hefty $6.6 billion to construct a new chip plant with three fabs in Arizona. The Taiwanese chipmaker is expected to invest $65 billion into the project.
The plant’s first fab will be up and running in the first half of 2025, leveraging 4 nm (nanometer) technology. According to TrendForce, the other fabs will produce chips on more advanced 3 nm and 2 nm processes.
The Latest Grant Goes to Micron
Micron, the only U.S.-based manufacturer of memory chips, is set to receive $6.1 billion in grants to support its plans of investing $50 billion through 2030. This investment will be used to construct new fabs in Idaho and New York.

-

 Education1 week ago
How Hard Is It to Get Into an Ivy League School?
-

 Technology2 weeks ago
Ranked: Semiconductor Companies by Industry Revenue Share
-

 Markets2 weeks ago
Ranked: The World’s Top Flight Routes, by Revenue
-

 Demographics2 weeks ago
Population Projections: The World’s 6 Largest Countries in 2075
-

 Markets2 weeks ago
The Top 10 States by Real GDP Growth in 2023
-

 Demographics2 weeks ago
The Smallest Gender Wage Gaps in OECD Countries
-

 Economy2 weeks ago
Where U.S. Inflation Hit the Hardest in March 2024
-

 Green2 weeks ago
Top Countries By Forest Growth Since 2001