Markets
Retail Apocalypse: Everything You Need to Know
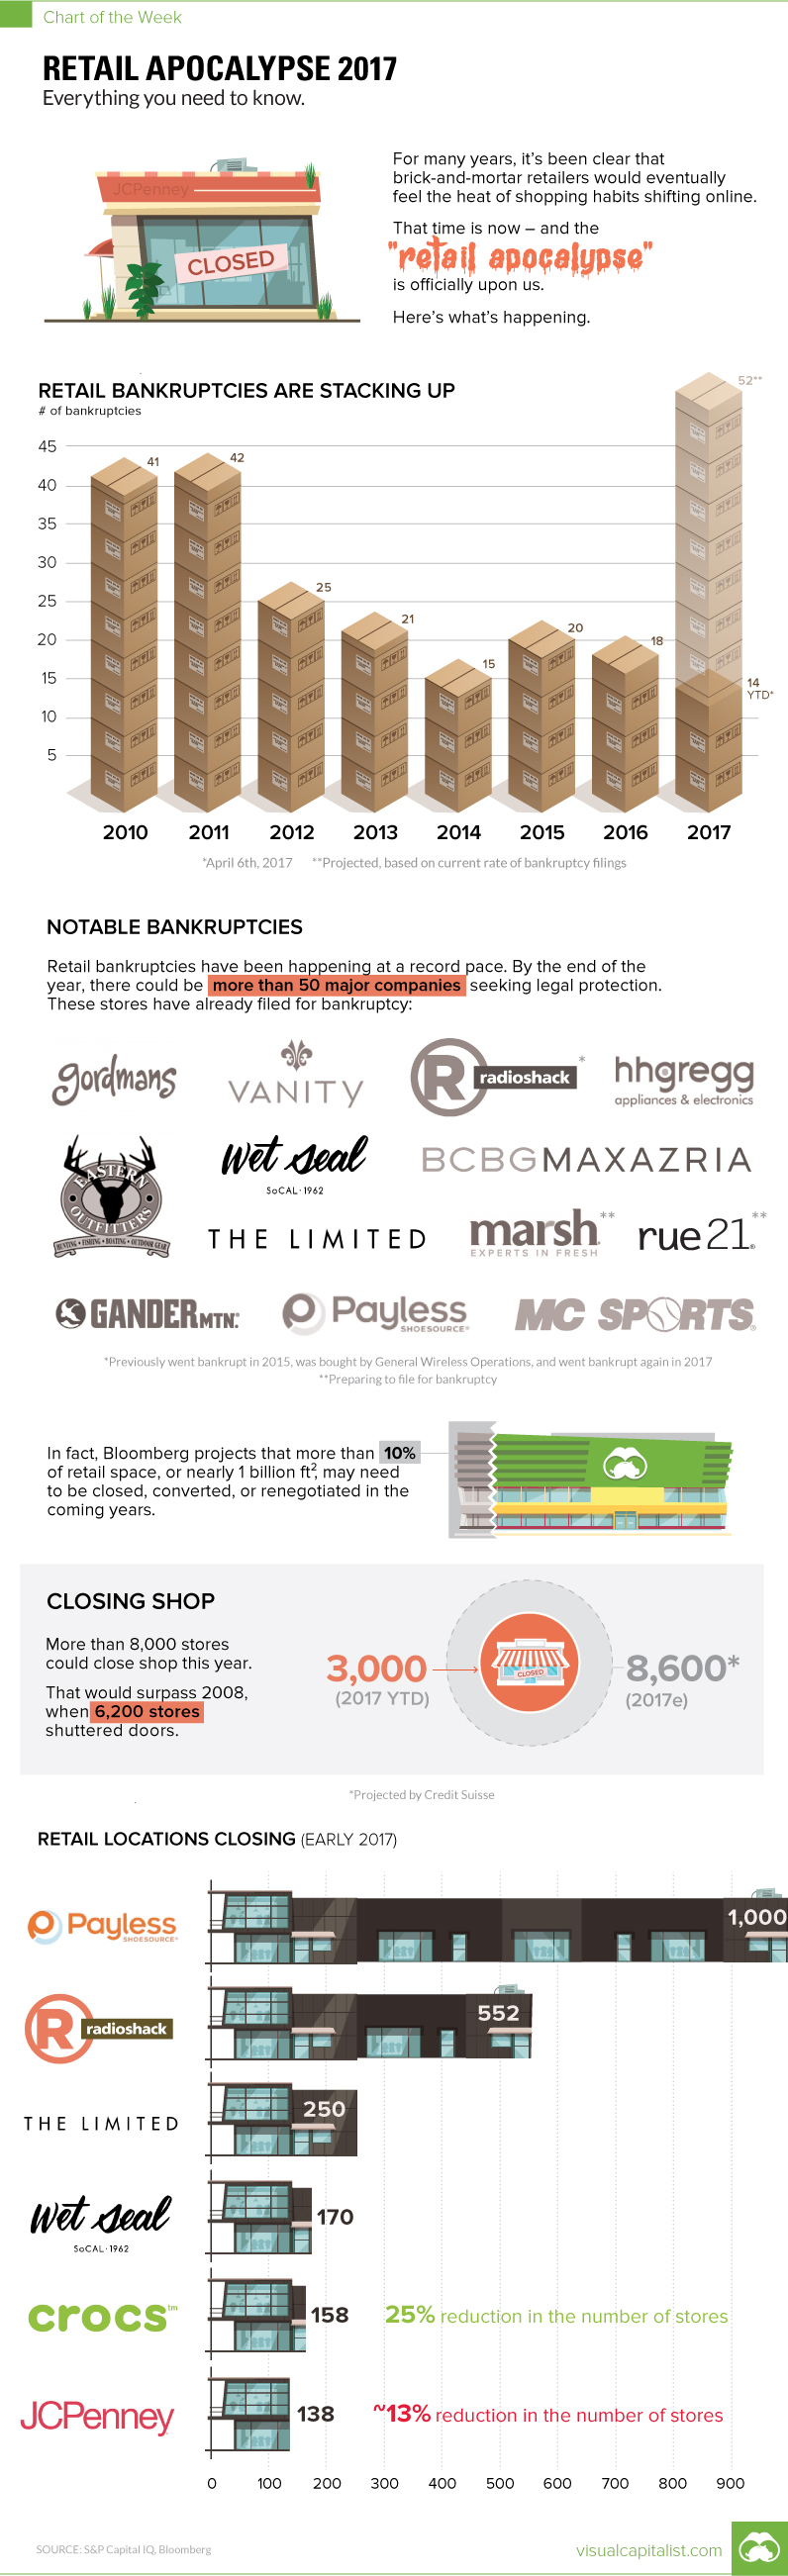
Chart: Retail Apocalypse 2017
The Chart of the Week is a weekly Visual Capitalist feature on Fridays.
The steady rise of online retail sales should have surprised no one.
Back in 2000, less than 1% of retail sales came from e-commerce. However, online sales have climbed each and every year since then, even through the Great Recession. By 2009, e-commerce made up about 4.0% of total retail sales, and today the latest number we have is 8.3%.
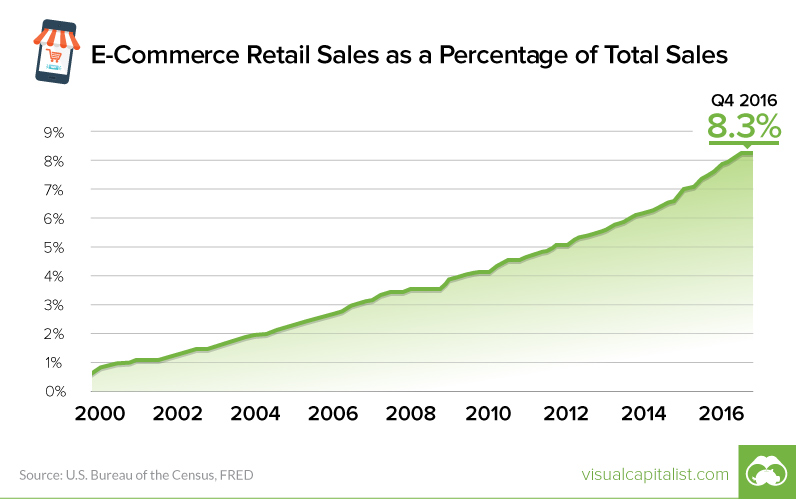
Here’s another knowledge bomb: it’s going to keep growing for the foreseeable future. Huge surprise, right?
Signs of a Reckoning
Retailers eye their competition relentlessly, and the sector also has notoriously thin margins.
The big retailers must have seen the “retail apocalypse” coming. The question is: what did they do about it?
Well, companies like Sears failed the shift to digital altogether – in fact, it is even widely speculated that the former behemoth might file for bankruptcy later this year.
The majority of other companies, on the other hand, are trying to combine “clicks and bricks” into a cohesive strategy. This sounds good in theory, but for established and sprawling brick and mortar retailers with excessive overhead costs, such tactics may not be enough to ward off this powerful secular trend. Target, for example, has had impressive growth in online sales, but they still only make up just 5% of total sales. As a result, the company’s robustness is also in doubt.
Wal-Mart took another route, which could potentially be the smartest one. The company hedged their bets by buying Jet.com, which was one of the fastest growing online retailers at the time. Later, they followed up by buying an online shoe retailer to help fill a perceived gap in footwear. Recent reports have surfaced, saying that these acquisitions are leading to staff shakeups, as the company re-orients its focus.
After all, going online is not just a tactic to boost sales in the new era of retailing. It has to be a mindset, and one that is central to the company’s strategy. Hopefully Wal-mart gets that, otherwise they will also be in trouble as well.
Apocalypse Now
In the midst of all of this is what is described as the “retail apocalypse”.
There are two main metrics that are pretty black and white:
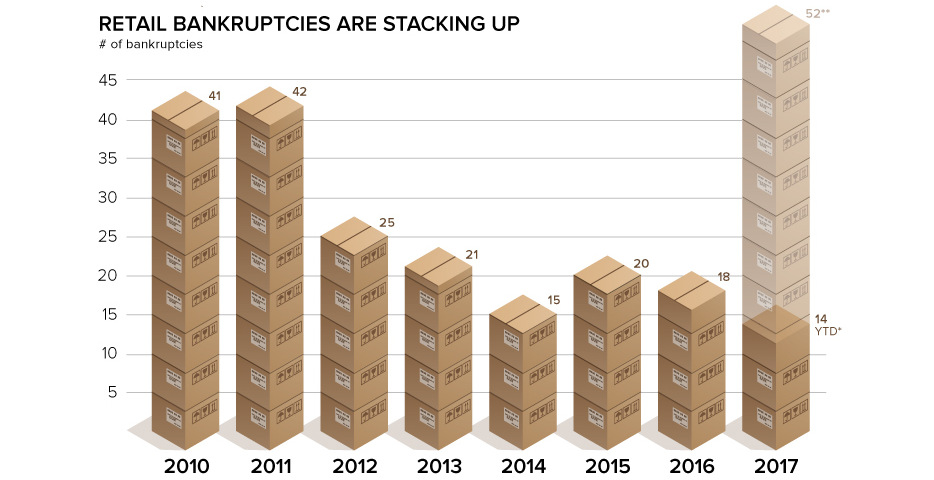
Number of Bankruptcies: We’re not even one-third through 2017, and we already have about as many retail bankruptcies as the previous year’s total. If they continue at the current pace, we could see over 50 retailers bankrupt by the end of the year.
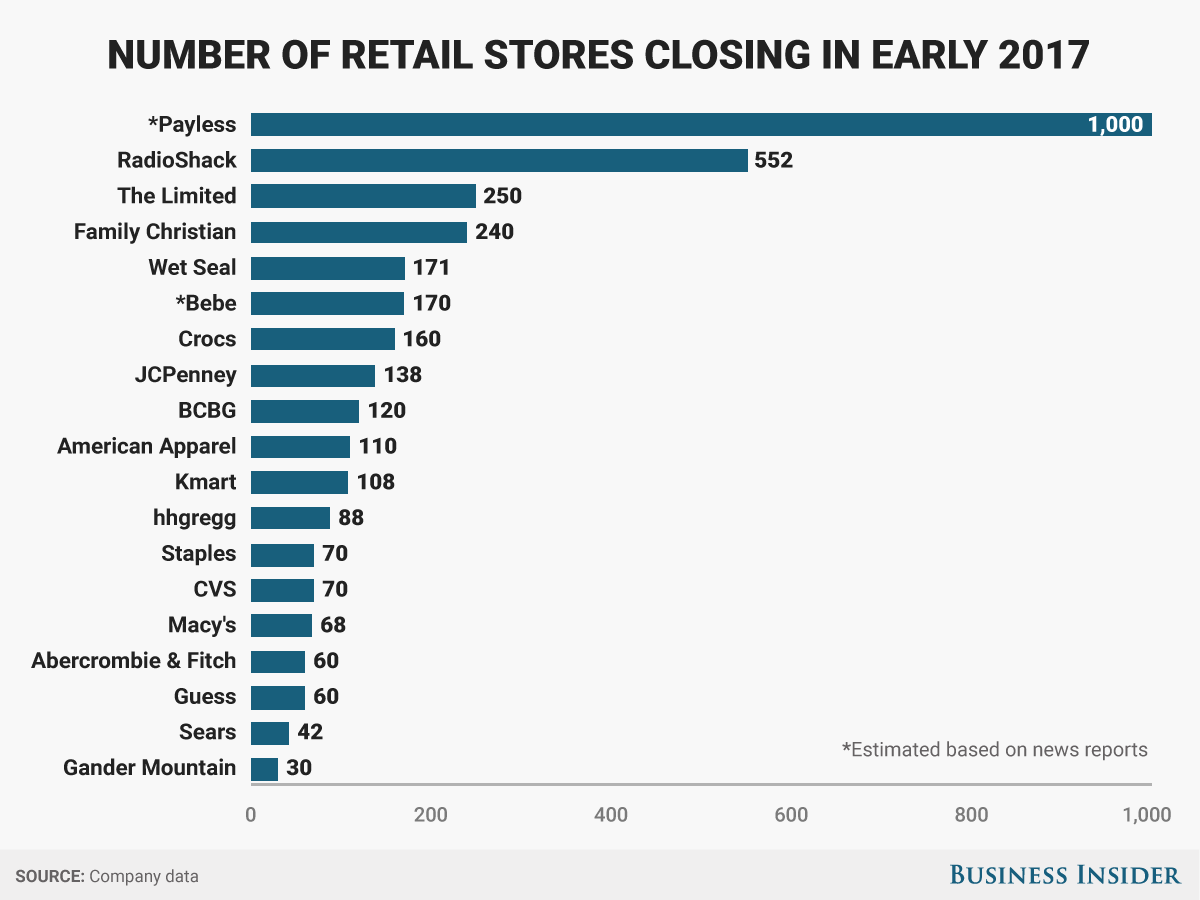
Number of Store Closings: So far we’ve seen roughly 3,000 store closings announced in 2017, and Credit Suisse estimates that could hit 8,600 by the end of the year. That would easily surpass 2008’s total, which was 6,200 closings, to be the worst year in recent memory.
Here’s some of the companies that have already filed for bankruptcy:
- Gordmans Stores
- Gander Mountain
- Radioshack (again)
- HHGregg
- BCBG Max Azria
- Eastern Outfitters
- Wet Seal
- The Limited
- Vanity Shop of Grand Forks
- Payless Inc.
- MC Sports
And here are the store closings occurring as a result of the retail apocalypse:


Economy
Economic Growth Forecasts for G7 and BRICS Countries in 2024
The IMF has released its economic growth forecasts for 2024. How do the G7 and BRICS countries compare?


G7 & BRICS Real GDP Growth Forecasts for 2024
The International Monetary Fund’s (IMF) has released its real gross domestic product (GDP) growth forecasts for 2024, and while global growth is projected to stay steady at 3.2%, various major nations are seeing declining forecasts.
This chart visualizes the 2024 real GDP growth forecasts using data from the IMF’s 2024 World Economic Outlook for G7 and BRICS member nations along with Saudi Arabia, which is still considering an invitation to join the bloc.
Get the Key Insights of the IMF’s World Economic Outlook
Want a visual breakdown of the insights from the IMF’s 2024 World Economic Outlook report?
This visual is part of a special dispatch of the key takeaways exclusively for VC+ members.
Get the full dispatch of charts by signing up to VC+.
Mixed Economic Growth Prospects for Major Nations in 2024
Economic growth projections by the IMF for major nations are mixed, with the majority of G7 and BRICS countries forecasted to have slower growth in 2024 compared to 2023.
Only three BRICS-invited or member countries, Saudi Arabia, the UAE, and South Africa, have higher projected real GDP growth rates in 2024 than last year.
| Group | Country | Real GDP Growth (2023) | Real GDP Growth (2024P) |
|---|---|---|---|
| G7 | 🇺🇸 U.S. | 2.5% | 2.7% |
| G7 | 🇨🇦 Canada | 1.1% | 1.2% |
| G7 | 🇯🇵 Japan | 1.9% | 0.9% |
| G7 | 🇫🇷 France | 0.9% | 0.7% |
| G7 | 🇮🇹 Italy | 0.9% | 0.7% |
| G7 | 🇬🇧 UK | 0.1% | 0.5% |
| G7 | 🇩🇪 Germany | -0.3% | 0.2% |
| BRICS | 🇮🇳 India | 7.8% | 6.8% |
| BRICS | 🇨🇳 China | 5.2% | 4.6% |
| BRICS | 🇦🇪 UAE | 3.4% | 3.5% |
| BRICS | 🇮🇷 Iran | 4.7% | 3.3% |
| BRICS | 🇷🇺 Russia | 3.6% | 3.2% |
| BRICS | 🇪🇬 Egypt | 3.8% | 3.0% |
| BRICS-invited | 🇸🇦 Saudi Arabia | -0.8% | 2.6% |
| BRICS | 🇧🇷 Brazil | 2.9% | 2.2% |
| BRICS | 🇿🇦 South Africa | 0.6% | 0.9% |
| BRICS | 🇪🇹 Ethiopia | 7.2% | 6.2% |
| 🌍 World | 3.2% | 3.2% |
China and India are forecasted to maintain relatively high growth rates in 2024 at 4.6% and 6.8% respectively, but compared to the previous year, China is growing 0.6 percentage points slower while India is an entire percentage point slower.
On the other hand, four G7 nations are set to grow faster than last year, which includes Germany making its comeback from its negative real GDP growth of -0.3% in 2023.
Faster Growth for BRICS than G7 Nations
Despite mostly lower growth forecasts in 2024 compared to 2023, BRICS nations still have a significantly higher average growth forecast at 3.6% compared to the G7 average of 1%.
While the G7 countries’ combined GDP is around $15 trillion greater than the BRICS nations, with continued higher growth rates and the potential to add more members, BRICS looks likely to overtake the G7 in economic size within two decades.
BRICS Expansion Stutters Before October 2024 Summit
BRICS’ recent expansion has stuttered slightly, as Argentina’s newly-elected president Javier Milei declined its invitation and Saudi Arabia clarified that the country is still considering its invitation and has not joined BRICS yet.
Even with these initial growing pains, South Africa’s Foreign Minister Naledi Pandor told reporters in February that 34 different countries have submitted applications to join the growing BRICS bloc.
Any changes to the group are likely to be announced leading up to or at the 2024 BRICS summit which takes place October 22-24 in Kazan, Russia.
Get the Full Analysis of the IMF’s Outlook on VC+
This visual is part of an exclusive special dispatch for VC+ members which breaks down the key takeaways from the IMF’s 2024 World Economic Outlook.
For the full set of charts and analysis, sign up for VC+.

-

 Markets1 week ago
U.S. Debt Interest Payments Reach $1 Trillion
-

 Markets2 weeks ago
Ranked: The Most Valuable Housing Markets in America
-

 Money2 weeks ago
Which States Have the Highest Minimum Wage in America?
-

 AI2 weeks ago
Ranked: Semiconductor Companies by Industry Revenue Share
-

 Markets2 weeks ago
Ranked: The World’s Top Flight Routes, by Revenue
-

 Countries2 weeks ago
Population Projections: The World’s 6 Largest Countries in 2075
-

 Markets2 weeks ago
The Top 10 States by Real GDP Growth in 2023
-

 Money2 weeks ago
The Smallest Gender Wage Gaps in OECD Countries