Markets
Visualizing Who Holds U.S. Debt Internationally
Visualizing Who Holds U.S. Debt Internationally
We recommend viewing the full-size version of today’s infographic by clicking here.
Everyone knows that the U.S. Federal Government has roughly $20 trillion of debt. A question we often get, however, is who exactly owns all these treasuries? And if it’s held abroad by countries like China, what portion do they hold?
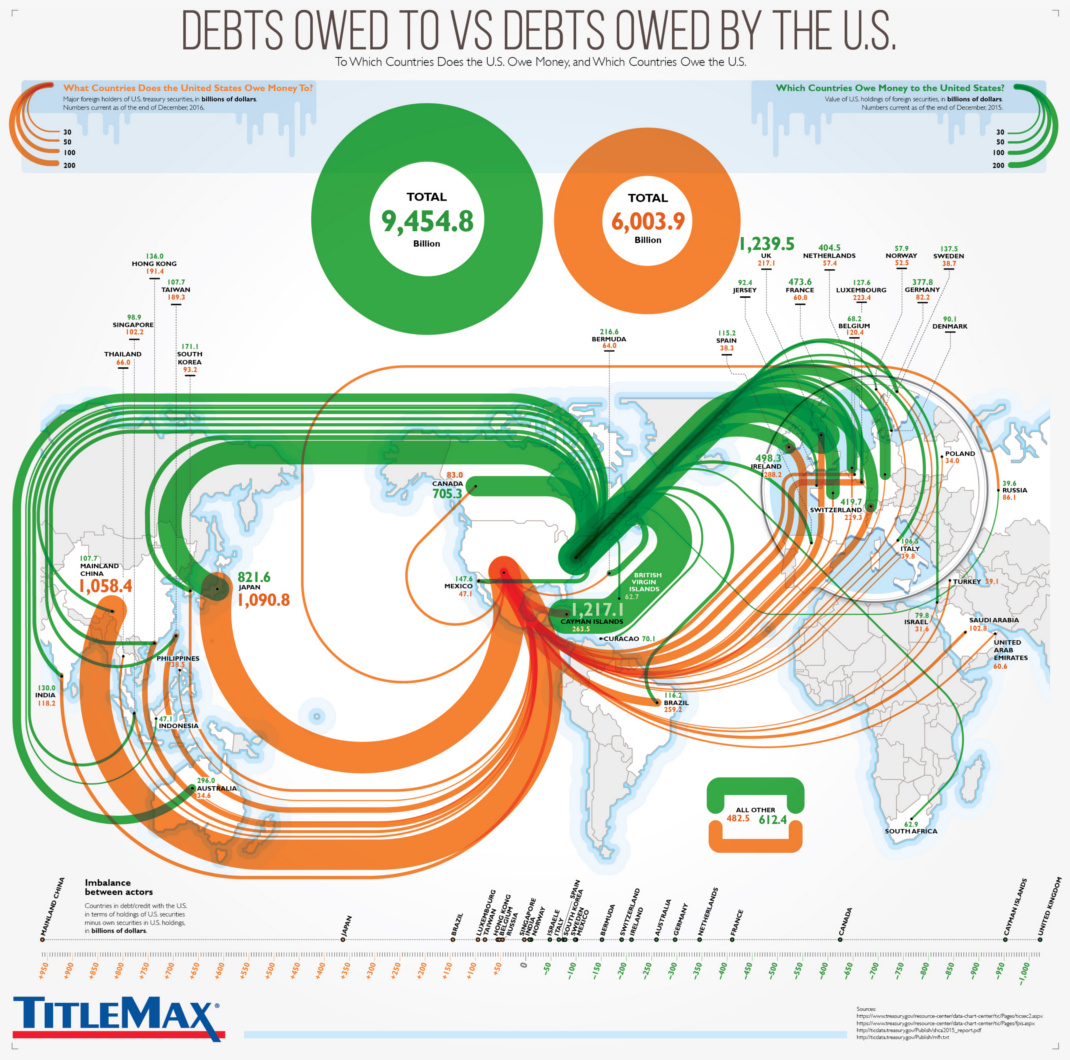
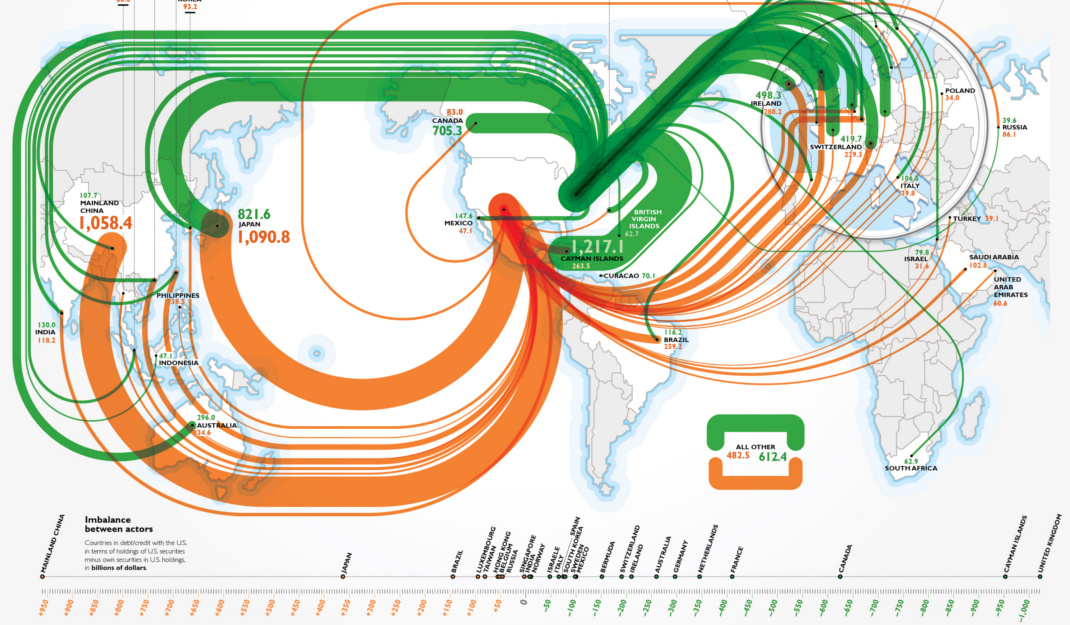
Today’s infographic comes from TitleMax, and it looks at who owns U.S. debt internationally, as well as the debt from other countries that is held by the U.S.
Who Holds U.S. Debt?
Federal government debt in the United States can be broadly placed in two categories: “Debt held by the public” and “Intragovernmental debt”. The former category includes securities held by individual investors, corporations, local and state governments, the Federal Reserve, and foreign governments.
Meanwhile, intragovernmental debt includes securities held in accounts administered by other federal authorities. This category, for example, would include treasuries owed to the Social Security Trust Fund.
Here’s the tallies of these two categories as of December 2016:
| Federal U.S. Debt (Billions) | |
|---|---|
| Debt held by the public | $14,202.1 |
| Intragovernmental debt | $5,395.7 |
| Total debt | $19,597.8 |
Debt Held By the Public
“Debt held by the public” is the most interesting of these, and it can be further broken down:
| Entity | U.S. Debt Held (Billions) |
|---|---|
| Foreign/International | $6,154.9 |
| Federal Reserve* | $2,490.6 |
| Mutual Funds | $1,524.8 |
| State and Local Gov'ts (incl. pensions) | $899.4 |
| Banks | $620.3 |
| Private pension funds | $549.1 |
| Insurance Companies | $344.8 |
| U.S. Savings Bonds | $165.8 |
| Other | $1,449.1 |
*Note: Data for Fed is for marketable securities only. All data in this table from September 2016.
About 43% of all debt held by the public is actually owned by foreign governments, corporations, and individuals.
U.S. Debt Held Internationally
Here’s how that breaks down by country:
| Country | U.S. Debt Held (Billions) |
|---|---|
| Japan | $1,090.8 |
| China | $1,058.4 |
| Ireland | $288.2 |
| Cayman Islands | $263.5 |
| Brazil | $259.2 |
| Switzerland | $229.9 |
| Luxembourg | $223.4 |
| United Kingdom | $217.1 |
| Hong Kong | $191.4 |
| Taiwan | $189.3 |
| India | $118.2 |
| Saudi Arabia | $102.8 |
| Others | $1,771.7 |
Note: This data is from December 2016


Economy
Economic Growth Forecasts for G7 and BRICS Countries in 2024
The IMF has released its economic growth forecasts for 2024. How do the G7 and BRICS countries compare?


G7 & BRICS Real GDP Growth Forecasts for 2024
The International Monetary Fund’s (IMF) has released its real gross domestic product (GDP) growth forecasts for 2024, and while global growth is projected to stay steady at 3.2%, various major nations are seeing declining forecasts.
This chart visualizes the 2024 real GDP growth forecasts using data from the IMF’s 2024 World Economic Outlook for G7 and BRICS member nations along with Saudi Arabia, which is still considering an invitation to join the bloc.
Get the Key Insights of the IMF’s World Economic Outlook
Want a visual breakdown of the insights from the IMF’s 2024 World Economic Outlook report?
This visual is part of a special dispatch of the key takeaways exclusively for VC+ members.
Get the full dispatch of charts by signing up to VC+.
Mixed Economic Growth Prospects for Major Nations in 2024
Economic growth projections by the IMF for major nations are mixed, with the majority of G7 and BRICS countries forecasted to have slower growth in 2024 compared to 2023.
Only three BRICS-invited or member countries, Saudi Arabia, the UAE, and South Africa, have higher projected real GDP growth rates in 2024 than last year.
| Group | Country | Real GDP Growth (2023) | Real GDP Growth (2024P) |
|---|---|---|---|
| G7 | 🇺🇸 U.S. | 2.5% | 2.7% |
| G7 | 🇨🇦 Canada | 1.1% | 1.2% |
| G7 | 🇯🇵 Japan | 1.9% | 0.9% |
| G7 | 🇫🇷 France | 0.9% | 0.7% |
| G7 | 🇮🇹 Italy | 0.9% | 0.7% |
| G7 | 🇬🇧 UK | 0.1% | 0.5% |
| G7 | 🇩🇪 Germany | -0.3% | 0.2% |
| BRICS | 🇮🇳 India | 7.8% | 6.8% |
| BRICS | 🇨🇳 China | 5.2% | 4.6% |
| BRICS | 🇦🇪 UAE | 3.4% | 3.5% |
| BRICS | 🇮🇷 Iran | 4.7% | 3.3% |
| BRICS | 🇷🇺 Russia | 3.6% | 3.2% |
| BRICS | 🇪🇬 Egypt | 3.8% | 3.0% |
| BRICS-invited | 🇸🇦 Saudi Arabia | -0.8% | 2.6% |
| BRICS | 🇧🇷 Brazil | 2.9% | 2.2% |
| BRICS | 🇿🇦 South Africa | 0.6% | 0.9% |
| BRICS | 🇪🇹 Ethiopia | 7.2% | 6.2% |
| 🌍 World | 3.2% | 3.2% |
China and India are forecasted to maintain relatively high growth rates in 2024 at 4.6% and 6.8% respectively, but compared to the previous year, China is growing 0.6 percentage points slower while India is an entire percentage point slower.
On the other hand, four G7 nations are set to grow faster than last year, which includes Germany making its comeback from its negative real GDP growth of -0.3% in 2023.
Faster Growth for BRICS than G7 Nations
Despite mostly lower growth forecasts in 2024 compared to 2023, BRICS nations still have a significantly higher average growth forecast at 3.6% compared to the G7 average of 1%.
While the G7 countries’ combined GDP is around $15 trillion greater than the BRICS nations, with continued higher growth rates and the potential to add more members, BRICS looks likely to overtake the G7 in economic size within two decades.
BRICS Expansion Stutters Before October 2024 Summit
BRICS’ recent expansion has stuttered slightly, as Argentina’s newly-elected president Javier Milei declined its invitation and Saudi Arabia clarified that the country is still considering its invitation and has not joined BRICS yet.
Even with these initial growing pains, South Africa’s Foreign Minister Naledi Pandor told reporters in February that 34 different countries have submitted applications to join the growing BRICS bloc.
Any changes to the group are likely to be announced leading up to or at the 2024 BRICS summit which takes place October 22-24 in Kazan, Russia.
Get the Full Analysis of the IMF’s Outlook on VC+
This visual is part of an exclusive special dispatch for VC+ members which breaks down the key takeaways from the IMF’s 2024 World Economic Outlook.
For the full set of charts and analysis, sign up for VC+.

-

 Markets1 week ago
U.S. Debt Interest Payments Reach $1 Trillion
-

 Business2 weeks ago
Charted: Big Four Market Share by S&P 500 Audits
-

 Markets2 weeks ago
Ranked: The Most Valuable Housing Markets in America
-

 Money2 weeks ago
Which States Have the Highest Minimum Wage in America?
-

 AI2 weeks ago
Ranked: Semiconductor Companies by Industry Revenue Share
-

 Markets2 weeks ago
Ranked: The World’s Top Flight Routes, by Revenue
-

 Countries2 weeks ago
Population Projections: The World’s 6 Largest Countries in 2075
-

 Markets2 weeks ago
The Top 10 States by Real GDP Growth in 2023