Markets
The Numbers Behind the World’s Closest Trade Relationship

Numbers Behind the World’s Closest Trade Relationship
Whether we’re discussing the ancient merchants that traversed the legendary Silk Road, or the transfer of goods across modern border lines, trade has always been about building close relationships.
There are many examples of strong and mutually-beneficial trade relationships all throughout history, but one doesn’t have to look far back to find what could be considered the closest bilateral relationship ever known: the one between the United States and Canada.
These two countries are each other’s best customers, and they share the world’s longest international border (5,525 miles long). They are both Western democracies with shared cultural heritage and similar standards of living – and each day, the two countries exchange a whopping US$1.7 billion in goods and services.
Our infographic today highlights numbers and tangible examples behind this lengthy relationship between the U.S. and Canada.
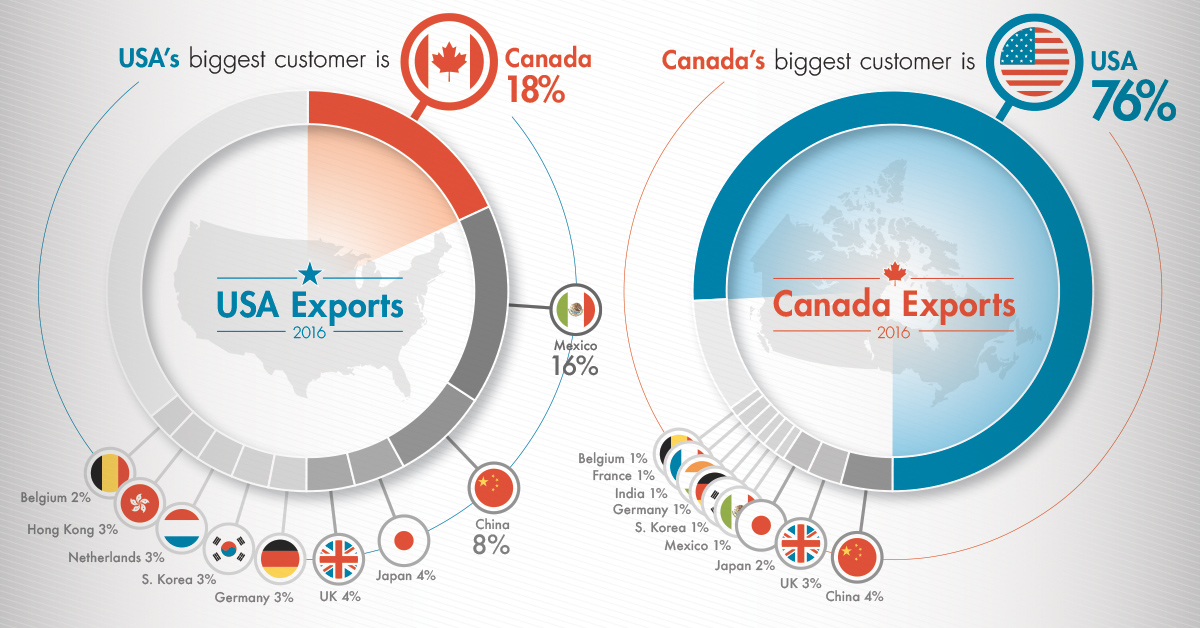
America’s Best Customer
Despite China surpassing Canada in 2015 to become America’s largest trading partner in aggregate, the majority of Chinese trade comes in the form of imports ($462B imports vs. $115B exports). That means China is actually only the third-largest customer of American-made goods, buying about 8% of total U.S. exports in 2016.
The largest buyer of American goods is still north of the border – in fact, Canadians buy about 18% of total U.S. exports, which is more than twice that of China.
Here’s what Canada buys from the U.S.:
| Rank | Goods | Value ($US) |
|---|---|---|
| #1 | Vehicles & Auto Parts | $48.1 billion |
| #2 | Machinery | $40.0 billion |
| #3 | Electronic equipment | $23.9 billion |
| #4 | Mineral fuels including oil | $15.5 billion |
| #5 | Plastics | $12.3 billion |
| #6 | Live trees and plants | $9.0 billion |
| #7 | Medical, technical equipment | $8.1 billion |
| #8 | Aircraft, spacecraft | $7.4 billion |
| #9 | Iron or steel products | $5.5 billion |
| #10 | Furniture, lighting, signs | $4.9 billion |
Canada is the most important international customer for 36 states – and every day the equivalent trade of all U.S./Japan happens over just one bridge (Ambassador Bridge) between Detroit, MI and Windsor, ON.
Canada’s Best Customer
Americans return the favor in a big way: an incredible 76% of Canadian exports are bought by Americans.
Here’s what the U.S. buys from Canada:
| Rank | Goods | Value ($US) |
|---|---|---|
| #1 | Vehicles & Auto Parts | $60.1 billion |
| #2 | Mineral fuels including oil | $57.6 billion |
| #3 | Machinery | $22.3 billion |
| #4 | Live trees and plants | $18.9 billion |
| #5 | Plastics | $10.9 billion |
| #6 | Wood | $10.1 billion |
| #7 | Electronic equipment | $9.4 billion |
| #8 | Gems, precious metals | $7.3 billion |
| #9 | Aluminum | $7.0 billion |
| #10 | Paper | $6.1 billion |
It’s estimated that 78% of Canadian exports to the U.S. are raw materials, parts and components, and services used to create other goods in the United States.
Close Ties
Through many years of trade, the supply chains between the two countries have become highly integrated.
Much of the time, the U.S. is buying raw materials and intermediate goods, which get used in final products destined for domestic and global markets. Many of those even get sold directly back to Canada.
This could be buying Canadian crude to reduce reliance on OPEC, importing low cost hydro electricity during times of heavy rainfall, or using Canada’s steady supply of aluminum to make more environmentally sound vehicles.
Few countries in the world have this kind of economic interdependence – and the history, integration, and value of goods traded makes this arguably the world’s closest bilateral trade relationship.


Markets
U.S. Debt Interest Payments Reach $1 Trillion
U.S. debt interest payments have surged past the $1 trillion dollar mark, amid high interest rates and an ever-expanding debt burden.


U.S. Debt Interest Payments Reach $1 Trillion
This was originally posted on our Voronoi app. Download the app for free on iOS or Android and discover incredible data-driven charts from a variety of trusted sources.
The cost of paying for America’s national debt crossed the $1 trillion dollar mark in 2023, driven by high interest rates and a record $34 trillion mountain of debt.
Over the last decade, U.S. debt interest payments have more than doubled amid vast government spending during the pandemic crisis. As debt payments continue to soar, the Congressional Budget Office (CBO) reported that debt servicing costs surpassed defense spending for the first time ever this year.
This graphic shows the sharp rise in U.S. debt payments, based on data from the Federal Reserve.
A $1 Trillion Interest Bill, and Growing
Below, we show how U.S. debt interest payments have risen at a faster pace than at another time in modern history:
| Date | Interest Payments | U.S. National Debt |
|---|---|---|
| 2023 | $1.0T | $34.0T |
| 2022 | $830B | $31.4T |
| 2021 | $612B | $29.6T |
| 2020 | $518B | $27.7T |
| 2019 | $564B | $23.2T |
| 2018 | $571B | $22.0T |
| 2017 | $493B | $20.5T |
| 2016 | $460B | $20.0T |
| 2015 | $435B | $18.9T |
| 2014 | $442B | $18.1T |
| 2013 | $425B | $17.2T |
| 2012 | $417B | $16.4T |
| 2011 | $433B | $15.2T |
| 2010 | $400B | $14.0T |
| 2009 | $354B | $12.3T |
| 2008 | $380B | $10.7T |
| 2007 | $414B | $9.2T |
| 2006 | $387B | $8.7T |
| 2005 | $355B | $8.2T |
| 2004 | $318B | $7.6T |
| 2003 | $294B | $7.0T |
| 2002 | $298B | $6.4T |
| 2001 | $318B | $5.9T |
| 2000 | $353B | $5.7T |
| 1999 | $353B | $5.8T |
| 1998 | $360B | $5.6T |
| 1997 | $368B | $5.5T |
| 1996 | $362B | $5.3T |
| 1995 | $357B | $5.0T |
| 1994 | $334B | $4.8T |
| 1993 | $311B | $4.5T |
| 1992 | $306B | $4.2T |
| 1991 | $308B | $3.8T |
| 1990 | $298B | $3.4T |
| 1989 | $275B | $3.0T |
| 1988 | $254B | $2.7T |
| 1987 | $240B | $2.4T |
| 1986 | $225B | $2.2T |
| 1985 | $219B | $1.9T |
| 1984 | $205B | $1.7T |
| 1983 | $176B | $1.4T |
| 1982 | $157B | $1.2T |
| 1981 | $142B | $1.0T |
| 1980 | $113B | $930.2B |
| 1979 | $96B | $845.1B |
| 1978 | $84B | $789.2B |
| 1977 | $69B | $718.9B |
| 1976 | $61B | $653.5B |
| 1975 | $55B | $576.6B |
| 1974 | $50B | $492.7B |
| 1973 | $45B | $469.1B |
| 1972 | $39B | $448.5B |
| 1971 | $36B | $424.1B |
| 1970 | $35B | $389.2B |
| 1969 | $30B | $368.2B |
| 1968 | $25B | $358.0B |
| 1967 | $23B | $344.7B |
| 1966 | $21B | $329.3B |
Interest payments represent seasonally adjusted annual rate at the end of Q4.
At current rates, the U.S. national debt is growing by a remarkable $1 trillion about every 100 days, equal to roughly $3.6 trillion per year.
As the national debt has ballooned, debt payments even exceeded Medicaid outlays in 2023—one of the government’s largest expenditures. On average, the U.S. spent more than $2 billion per day on interest costs last year. Going further, the U.S. government is projected to spend a historic $12.4 trillion on interest payments over the next decade, averaging about $37,100 per American.
Exacerbating matters is that the U.S. is running a steep deficit, which stood at $1.1 trillion for the first six months of fiscal 2024. This has accelerated due to the 43% increase in debt servicing costs along with a $31 billion dollar increase in defense spending from a year earlier. Additionally, a $30 billion increase in funding for the Federal Deposit Insurance Corporation in light of the regional banking crisis last year was a major contributor to the deficit increase.
Overall, the CBO forecasts that roughly 75% of the federal deficit’s increase will be due to interest costs by 2034.

-

 Green2 weeks ago
Ranked: Top Countries by Total Forest Loss Since 2001
-

 Travel1 week ago
Ranked: The World’s Top Flight Routes, by Revenue
-

 Technology2 weeks ago
Ranked: Semiconductor Companies by Industry Revenue Share
-

 Money2 weeks ago
Which States Have the Highest Minimum Wage in America?
-

 Real Estate2 weeks ago
Ranked: The Most Valuable Housing Markets in America
-

 Markets2 weeks ago
Charted: Big Four Market Share by S&P 500 Audits
-

 AI2 weeks ago
The Stock Performance of U.S. Chipmakers So Far in 2024
-

 Automotive2 weeks ago
Almost Every EV Stock is Down After Q1 2024