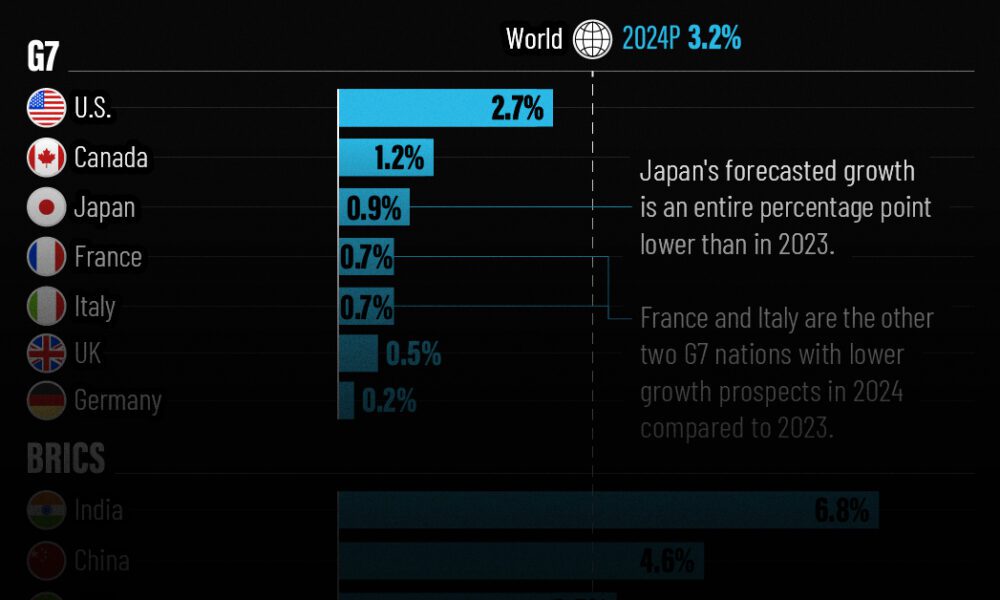
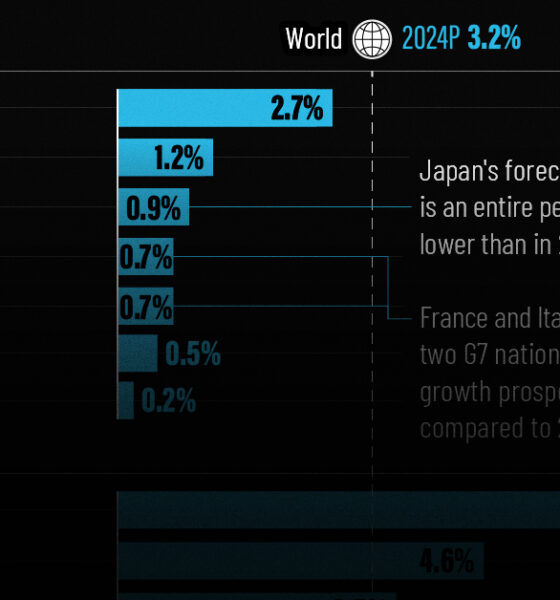
The IMF has released its economic growth forecasts for 2024. How do the G7 and BRICS countries compare?


The World’s Top Car Manufacturers by Market Cap View the high-resolution of the infographic by clicking here. Ever since Apple and other Big Tech companies hit...
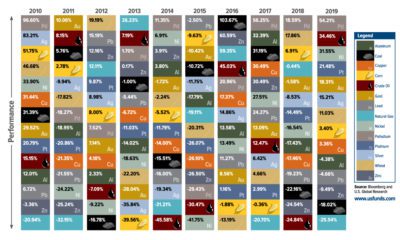

Which commodity had the best returns in 2020? From gold to oil, we show how commodity price performance stacks up over the last decade.
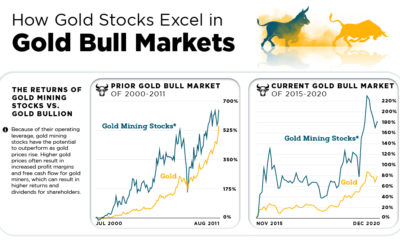

Gold mining stocks outpace gold returns in bull markets, but how? With higher gold prices, miners get ahead thanks to operating leverage.
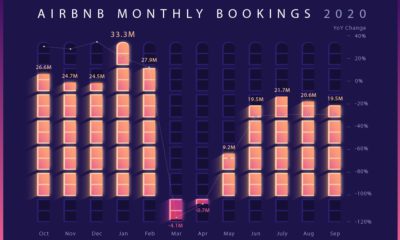

From rooms to revenue, this infographic breaks down the numbers behind the business of Airbnb—one of the most successful IPOs of 2020.


We analyzed 200+ articles, reports, and interviews to answer the question: Is there a consensus on what we can expect in 2021? Here are the results.
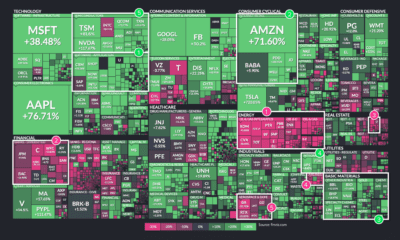

This treemap visualization shows the best and worst performing sectors of the stock market in 2020. We break down the winners and losers.
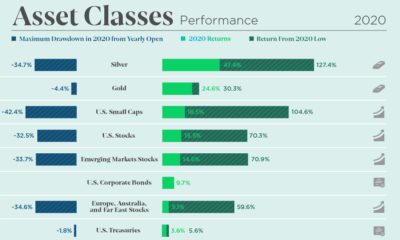

The markets were volatile but offered great opportunity in 2020. See how every asset class, currency, and S&P 500 sector performed over the year.
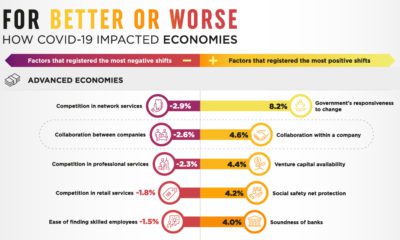

It’s been a rollercoaster year. Here’s a look at the economic impact of COVID-19 worldwide, according to a survey of global business leaders.
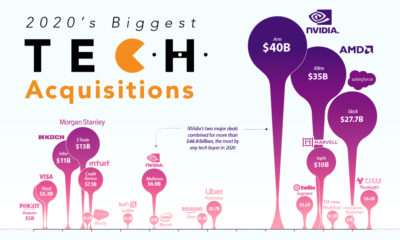

In a challenging year for most, many large tech companies have prospered and grown. We visualize the year’s biggest tech mergers and acquisitions.
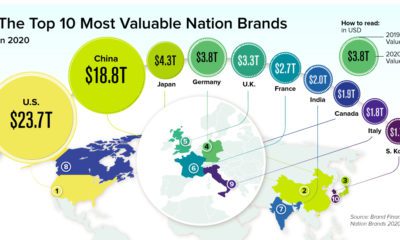

Here’s a look at the most valuable nation brands in 2020, and how the brand values of these countries have changed over time.


