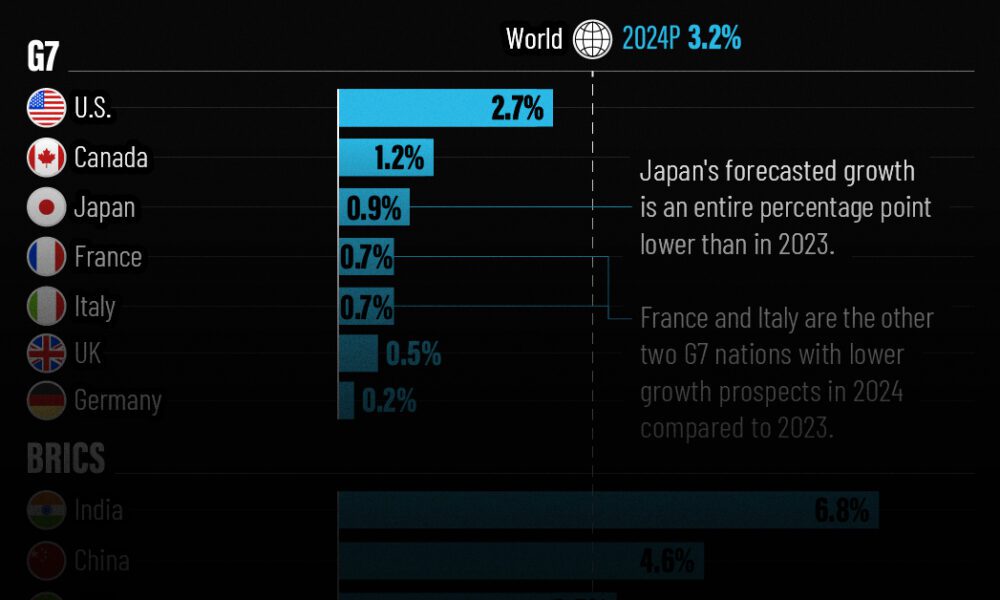
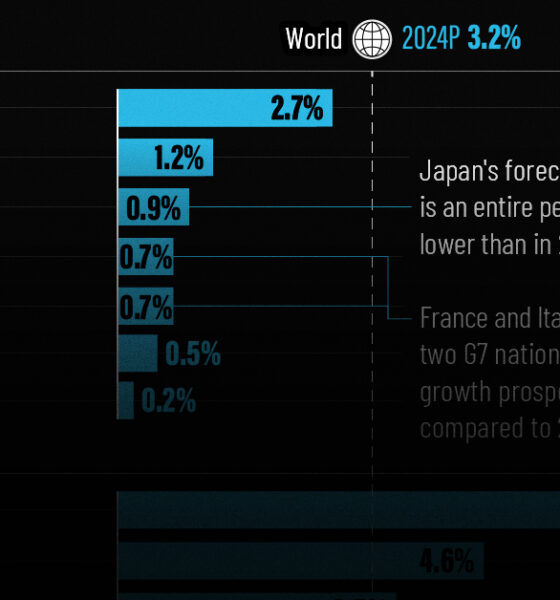
The IMF has released its economic growth forecasts for 2024. How do the G7 and BRICS countries compare?
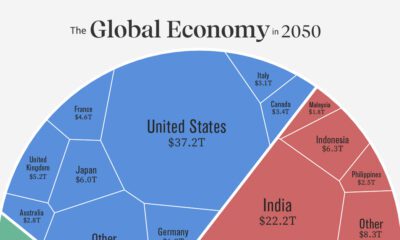

Asia is expected to represent the world's largest share of real GDP in 2050. See how this all breaks down in one chart.
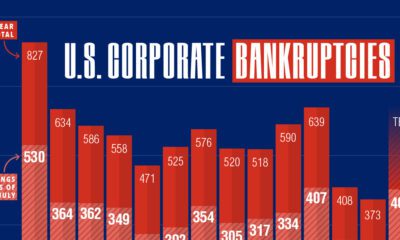

In 2023, over 400 companies have folded. This graphic shows how corporate bankruptcies are growing at the second-fastest rate since 2010.
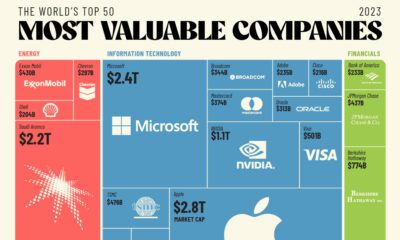

The world's 50 most valuable companies represent over $25 trillion in market cap. We break this massive figure down by company and sector.
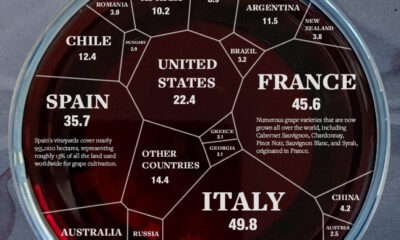

We break down the major wine producers of the world by country and how much they contribute to world wine supply.
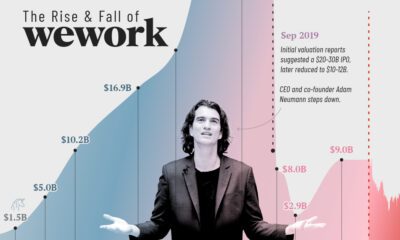

At the height of its success, WeWork was valued at $47 billion. Four years later, WeWork is worth a fraction of the total. What happened?


90% of investing is driven by emotions. But controlling impulses in turbulent markets is key to protecting your portfolio in the long run.
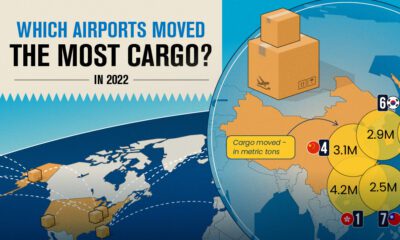

Cargo that moves through airports represents the value of around 35% of world trade. These hubs move the most cargo globally.
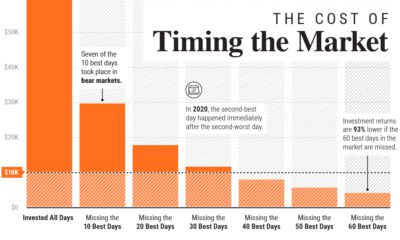

In this graphic, we show why timing the market is extremely difficult, and how it can meaningfully dent portfolio returns.
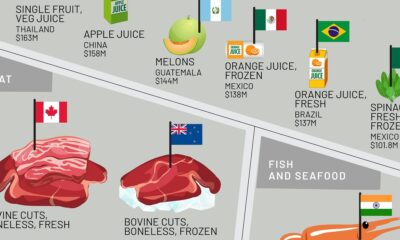

This infographic shows the top exporting countries for U.S. food imports, ranging from exotic fruits to meat, oils, spices, and more.
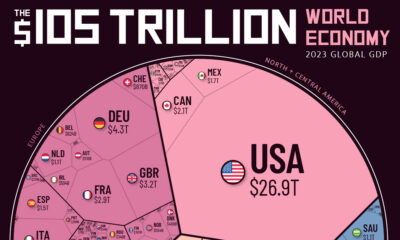

How much does each country contribute to the $105 trillion world economy in 2023, and what nations are seeing their nominal GDPs shrink?


 Creator Program