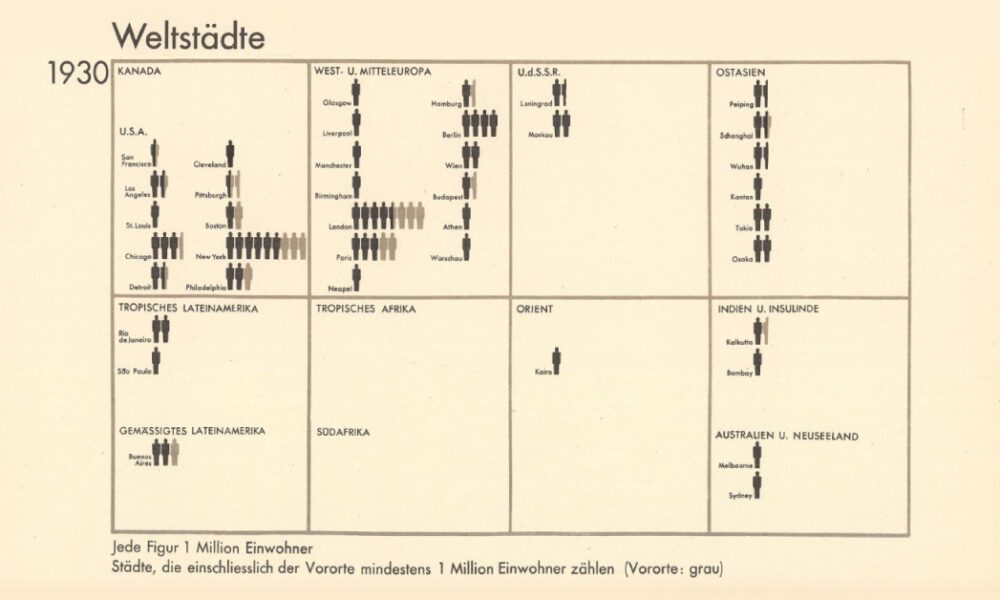
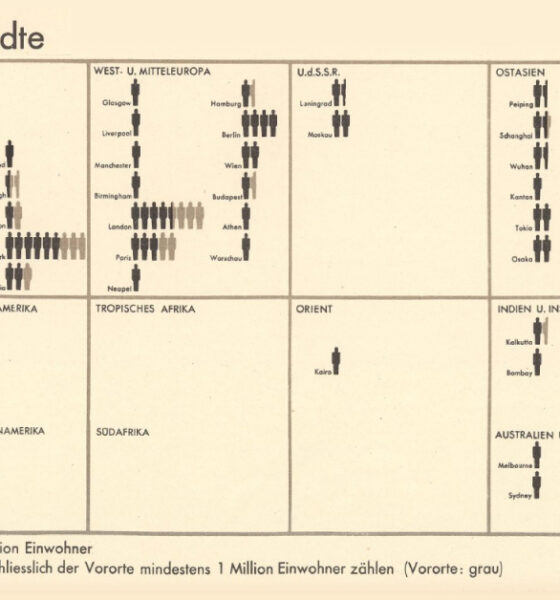
From someone born in the 19th century, in the midst of historic population growth, comes this vintage visualization showing world...
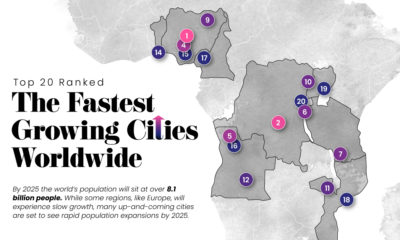

Nearly 60% of the world's population lives in cities and this trend is not slowing down—take a look at the world's 20 fastest growing cities.
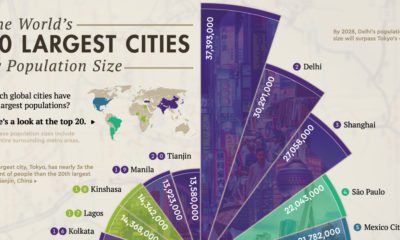

Where are the world’s largest cities in terms of population? This graphic looks at the top 20 most populous cities in the world.
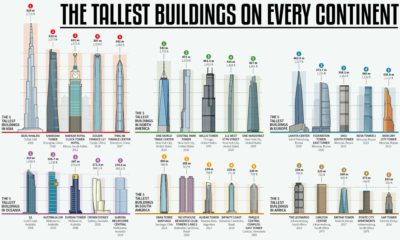

How much higher and further into the skies can we reach? This infographic looks at the most impressive skyscrapers gracing every continent.
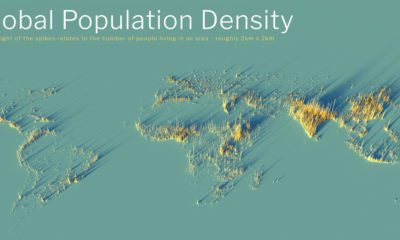

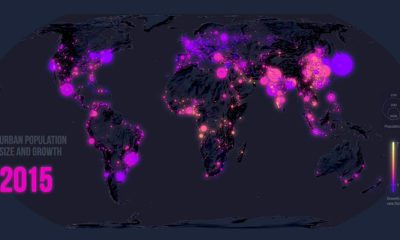
What does population density look like on a global scale? These detailed 3D renders illustrate our biggest urban areas and highlight population trends.
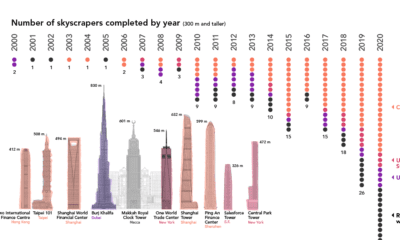

Once a rarity, supertall skyscrapers now punctuate the skylines of cities around the world. We chart the construction of these structures over the past 20 years
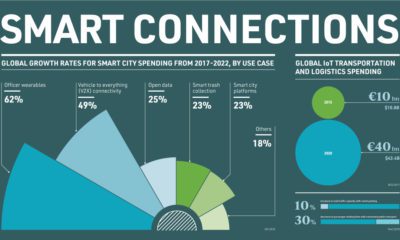

Spending on smart cities is ramping up, and it's being driven by the development and implementation of new IoT technologies.
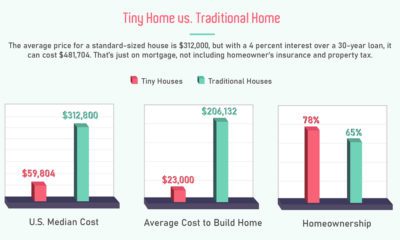

Tiny homes have grown into a multi-billion dollar industry—but is it just a millennial novelty, or a necessity for every generation?
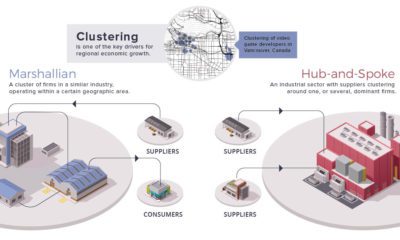

Economies create distinct spatial patterns. This week's chart visualizes the relationships businesses and industry imprint on the urban environment.

Few global trends have matched the profound impact of urbanization. Today’s map looks back at 70 years of movement in over 1,800 cities.
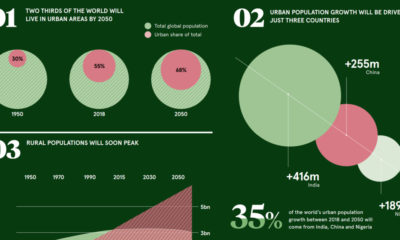

These pivotal trends show how urban demographics are aiding in the transition to a very different economic and investment landscape.


