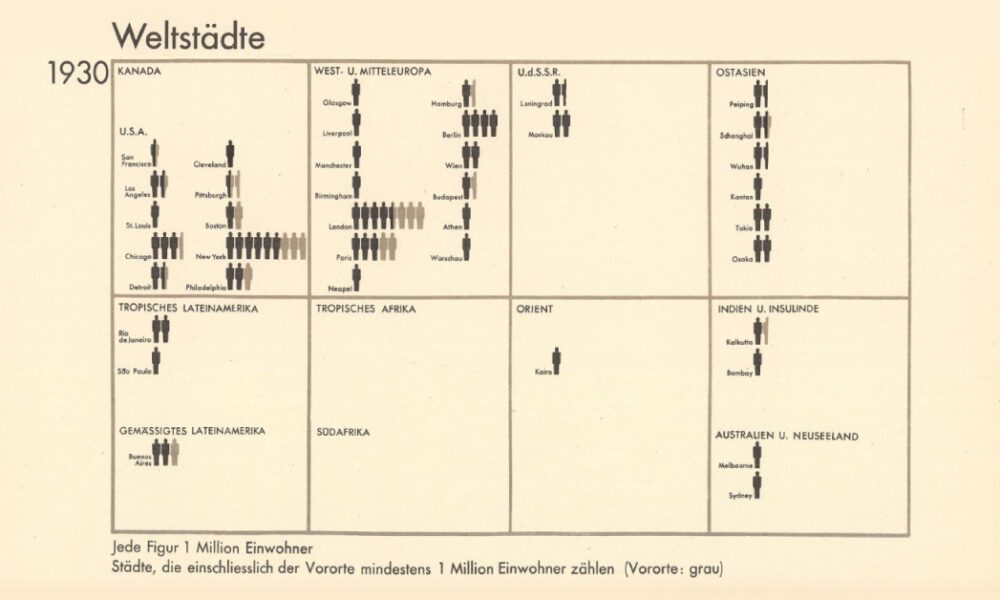
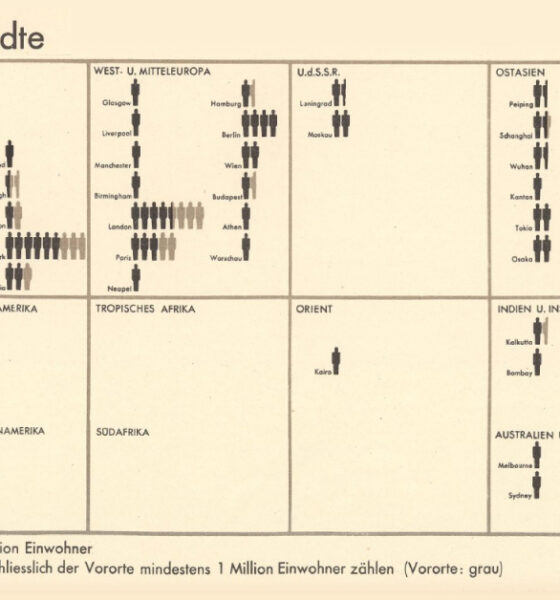
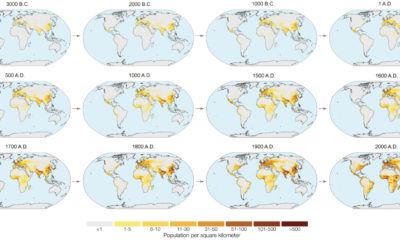
From someone born in the 19th century, in the midst of historic population growth, comes this vintage visualization showing world...


This map juxtaposes nations and Indian states to provide a new perspective on the world's soon-to-be most populous country
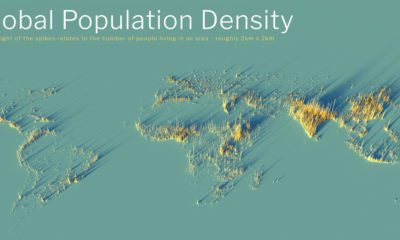

What does population density look like on a global scale? These detailed 3D renders illustrate our biggest urban areas and highlight population trends.
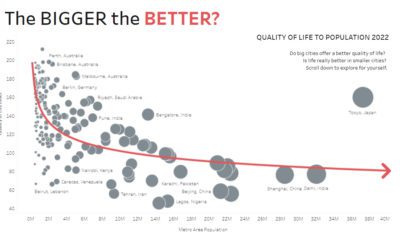

Are big cities all they’re cracked up to be? These interactive charts about population size question whether bigger always equals better.


Recent floods in Pakistan have affected more than 33 million people. Where is the risk of flooding highest around the world?
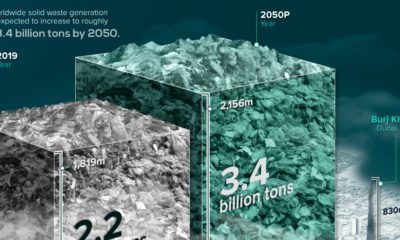

Waste generation is expected to jump over the next 30 years. See global waste visualized over this time period, along with waste per person.
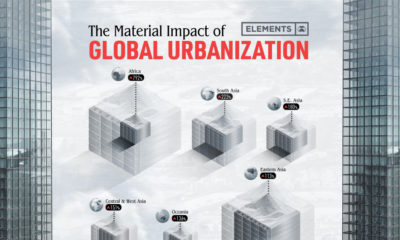

The world’s material consumption is expected to grow from 41 billion tonnes in 2010 to about 89 billion tonnes by 2050. This graphic shows the impact...
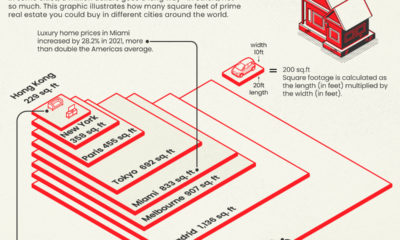

Is $1 million enough to buy you a luxury home? As this infographic shows, the answer varies greatly from city to city.

In the next year or so, humanity is expected to pass the 8 billion person milestone. These charts and maps put global population growth into context.
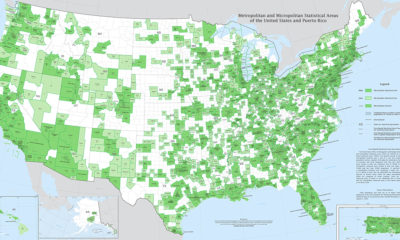

Fitting a complex population center into a tidy statistical box is no easy feat. Thankfully, this U.S. Census Bureau map is up to the challenge.
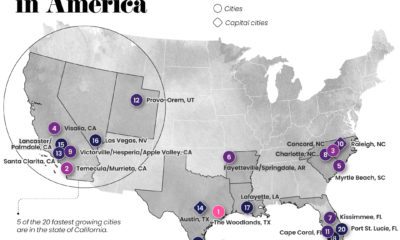

Which U.S. cities are growing the fastest? Here are the 20 fastest growing cities in the U.S., based on projected population growth to 2025.


 Creator Program