Technology
A Beginner’s Guide to Cryptocurrencies

A Beginner’s Guide to Cryptocurrencies
With money pouring into the blockchain from investors, venture capitalists, and strategic partners, it is clear that cryptocurrencies will continue to be in the spotlight for years to come.
However, as with any newly emerging field, being in the spotlight can present a double-edged sword. It makes for an environment full of passionate and extremely technical discussion, but it also opens the door to blatant promotional pump-and-dump schemes and inflexible factions of cheerleaders or naysayers.
This clutter makes it considerably difficult for the average person to really wrap their head around the crypto space – and it creates opportunities to simplify the sector in an easy, digestible, and accessible way.
A Guide to Cryptocurrencies
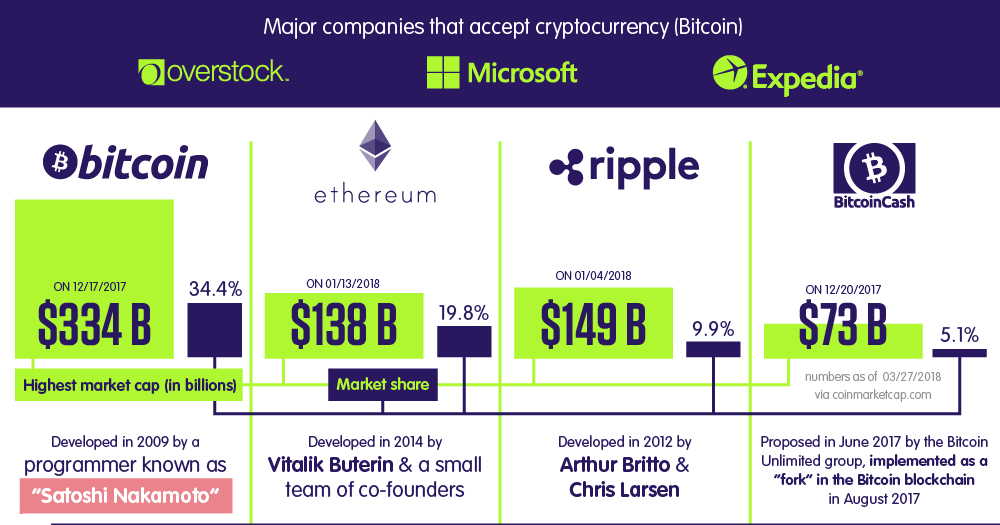
Today’s infographic from BestAccountingSchools provides an introductory guide to cryptocurrencies, and it highlights the history, important terms, and statistics about the crypto space. It also profiles some of the pioneers that made it all happen.
It’s a great start for anyone looking to get up to speed on what’s happening in crypto – and we thought we would accompany it with some additional infographic resources that we have available on the topic as well.
Bitcoin’s Journey to $10,000 – This timeline chart catalogs Bitcoin’s wild 2017, in which it catapulted from $1,000 to $10,000 in just 11 months.
Comparing Crypto – This giant infographic compares the differences in design and protocol of six key cryptocurrencies: Bitcoin, Ethereum, Litecoin, Ethereum Classic, Dash, and Ripple.
The ICO Explosion – The popularity of cryptocurrency has also led to a boom in initial coin offerings (ICOs). This nifty data visualization helps to show this.
Top 25 Cryptocurrencies – This infographic showcases the top 25 cryptocurrencies, organized by different factors: market cap, trading volume, purpose, and inception date.
Intro to Smart Contracts – Cryptocurrencies aren’t just about payments – they are also being used to automate transactions to avoid middlemen. This infographic on the power of smart contracts helps to introduce these concepts.
Historical Context – All the way back in 2013 and 2014, we put together infographics documenting the first 5 years of Bitcoin’s history, as well as why we predicted that Bitcoin would eventually disrupt banking in 2014.
Do you have any other great graphical resources that could be included for a beginner’s guide to cryptocurrencies? Let us know in the comments.


Technology
All of the Grants Given by the U.S. CHIPS Act
Intel, TSMC, and more have received billions in subsidies from the U.S. CHIPS Act in 2024.


All of the Grants Given by the U.S. CHIPS Act
This was originally posted on our Voronoi app. Download the app for free on iOS or Android and discover incredible data-driven charts from a variety of trusted sources.
This visualization shows which companies are receiving grants from the U.S. CHIPS Act, as of April 25, 2024. The CHIPS Act is a federal statute signed into law by President Joe Biden that authorizes $280 billion in new funding to boost domestic research and manufacturing of semiconductors.
The grant amounts visualized in this graphic are intended to accelerate the production of semiconductor fabrication plants (fabs) across the United States.
Data and Company Highlights
The figures we used to create this graphic were collected from a variety of public news sources. The Semiconductor Industry Association (SIA) also maintains a tracker for CHIPS Act recipients, though at the time of writing it does not have the latest details for Micron.
| Company | Federal Grant Amount | Anticipated Investment From Company |
|---|---|---|
| 🇺🇸 Intel | $8,500,000,000 | $100,000,000,000 |
| 🇹🇼 TSMC | $6,600,000,000 | $65,000,000,000 |
| 🇰🇷 Samsung | $6,400,000,000 | $45,000,000,000 |
| 🇺🇸 Micron | $6,100,000,000 | $50,000,000,000 |
| 🇺🇸 GlobalFoundries | $1,500,000,000 | $12,000,000,000 |
| 🇺🇸 Microchip | $162,000,000 | N/A |
| 🇬🇧 BAE Systems | $35,000,000 | N/A |
BAE Systems was not included in the graphic due to size limitations
Intel’s Massive Plans
Intel is receiving the largest share of the pie, with $8.5 billion in grants (plus an additional $11 billion in government loans). This grant accounts for 22% of the CHIPS Act’s total subsidies for chip production.
From Intel’s side, the company is expected to invest $100 billion to construct new fabs in Arizona and Ohio, while modernizing and/or expanding existing fabs in Oregon and New Mexico. Intel could also claim another $25 billion in credits through the U.S. Treasury Department’s Investment Tax Credit.
TSMC Expands its U.S. Presence
TSMC, the world’s largest semiconductor foundry company, is receiving a hefty $6.6 billion to construct a new chip plant with three fabs in Arizona. The Taiwanese chipmaker is expected to invest $65 billion into the project.
The plant’s first fab will be up and running in the first half of 2025, leveraging 4 nm (nanometer) technology. According to TrendForce, the other fabs will produce chips on more advanced 3 nm and 2 nm processes.
The Latest Grant Goes to Micron
Micron, the only U.S.-based manufacturer of memory chips, is set to receive $6.1 billion in grants to support its plans of investing $50 billion through 2030. This investment will be used to construct new fabs in Idaho and New York.

-

 Science1 week ago
Visualizing the Average Lifespans of Mammals
-

 Markets2 weeks ago
The Top 10 States by Real GDP Growth in 2023
-

 Demographics2 weeks ago
The Smallest Gender Wage Gaps in OECD Countries
-

 United States2 weeks ago
Where U.S. Inflation Hit the Hardest in March 2024
-

 Green2 weeks ago
Top Countries By Forest Growth Since 2001
-

 United States2 weeks ago
Ranked: The Largest U.S. Corporations by Number of Employees
-

 Maps2 weeks ago
The Largest Earthquakes in the New York Area (1970-2024)
-

 Green2 weeks ago
Ranked: The Countries With the Most Air Pollution in 2023