Technology
Comparing Bitcoin, Ethereum, and Other Cryptos
View a high resolution version of this graphic
Comparing Bitcoin, Ethereum, and Other Cryptos
View the high resolution version of today’s graphic by clicking here.
Unless you’ve been hiding under a rock, you’re probably aware that we’re in the middle of a cryptocurrency explosion. In one year, the value of all currencies increased a staggering 1,466% – and newer coins like Ethereum have even joined Bitcoin in gaining some mainstream acceptance.
And while people like Jamie Dimon of J.P. Morgan and famed value investor Howard Marks have been extremely critical of cryptocurrencies as of late, many other investors are continuing to ride the wave. As we’ve noted in the past, the possible effects of the blockchain cannot be understated, and it could even change the backbone of how financial markets work.
However, even with the excitement and action that comes with the space, a major problem still exists for the layman: it’s really challenging to decipher the differences between cryptocurrencies like Bitcoin, Ethereum, Ethereum Classic, Litecoin, Ripple, and Dash.
For this reason, we worked with social trading network eToro to come up with an infographic that breaks down the major differences between these coins all in one place.
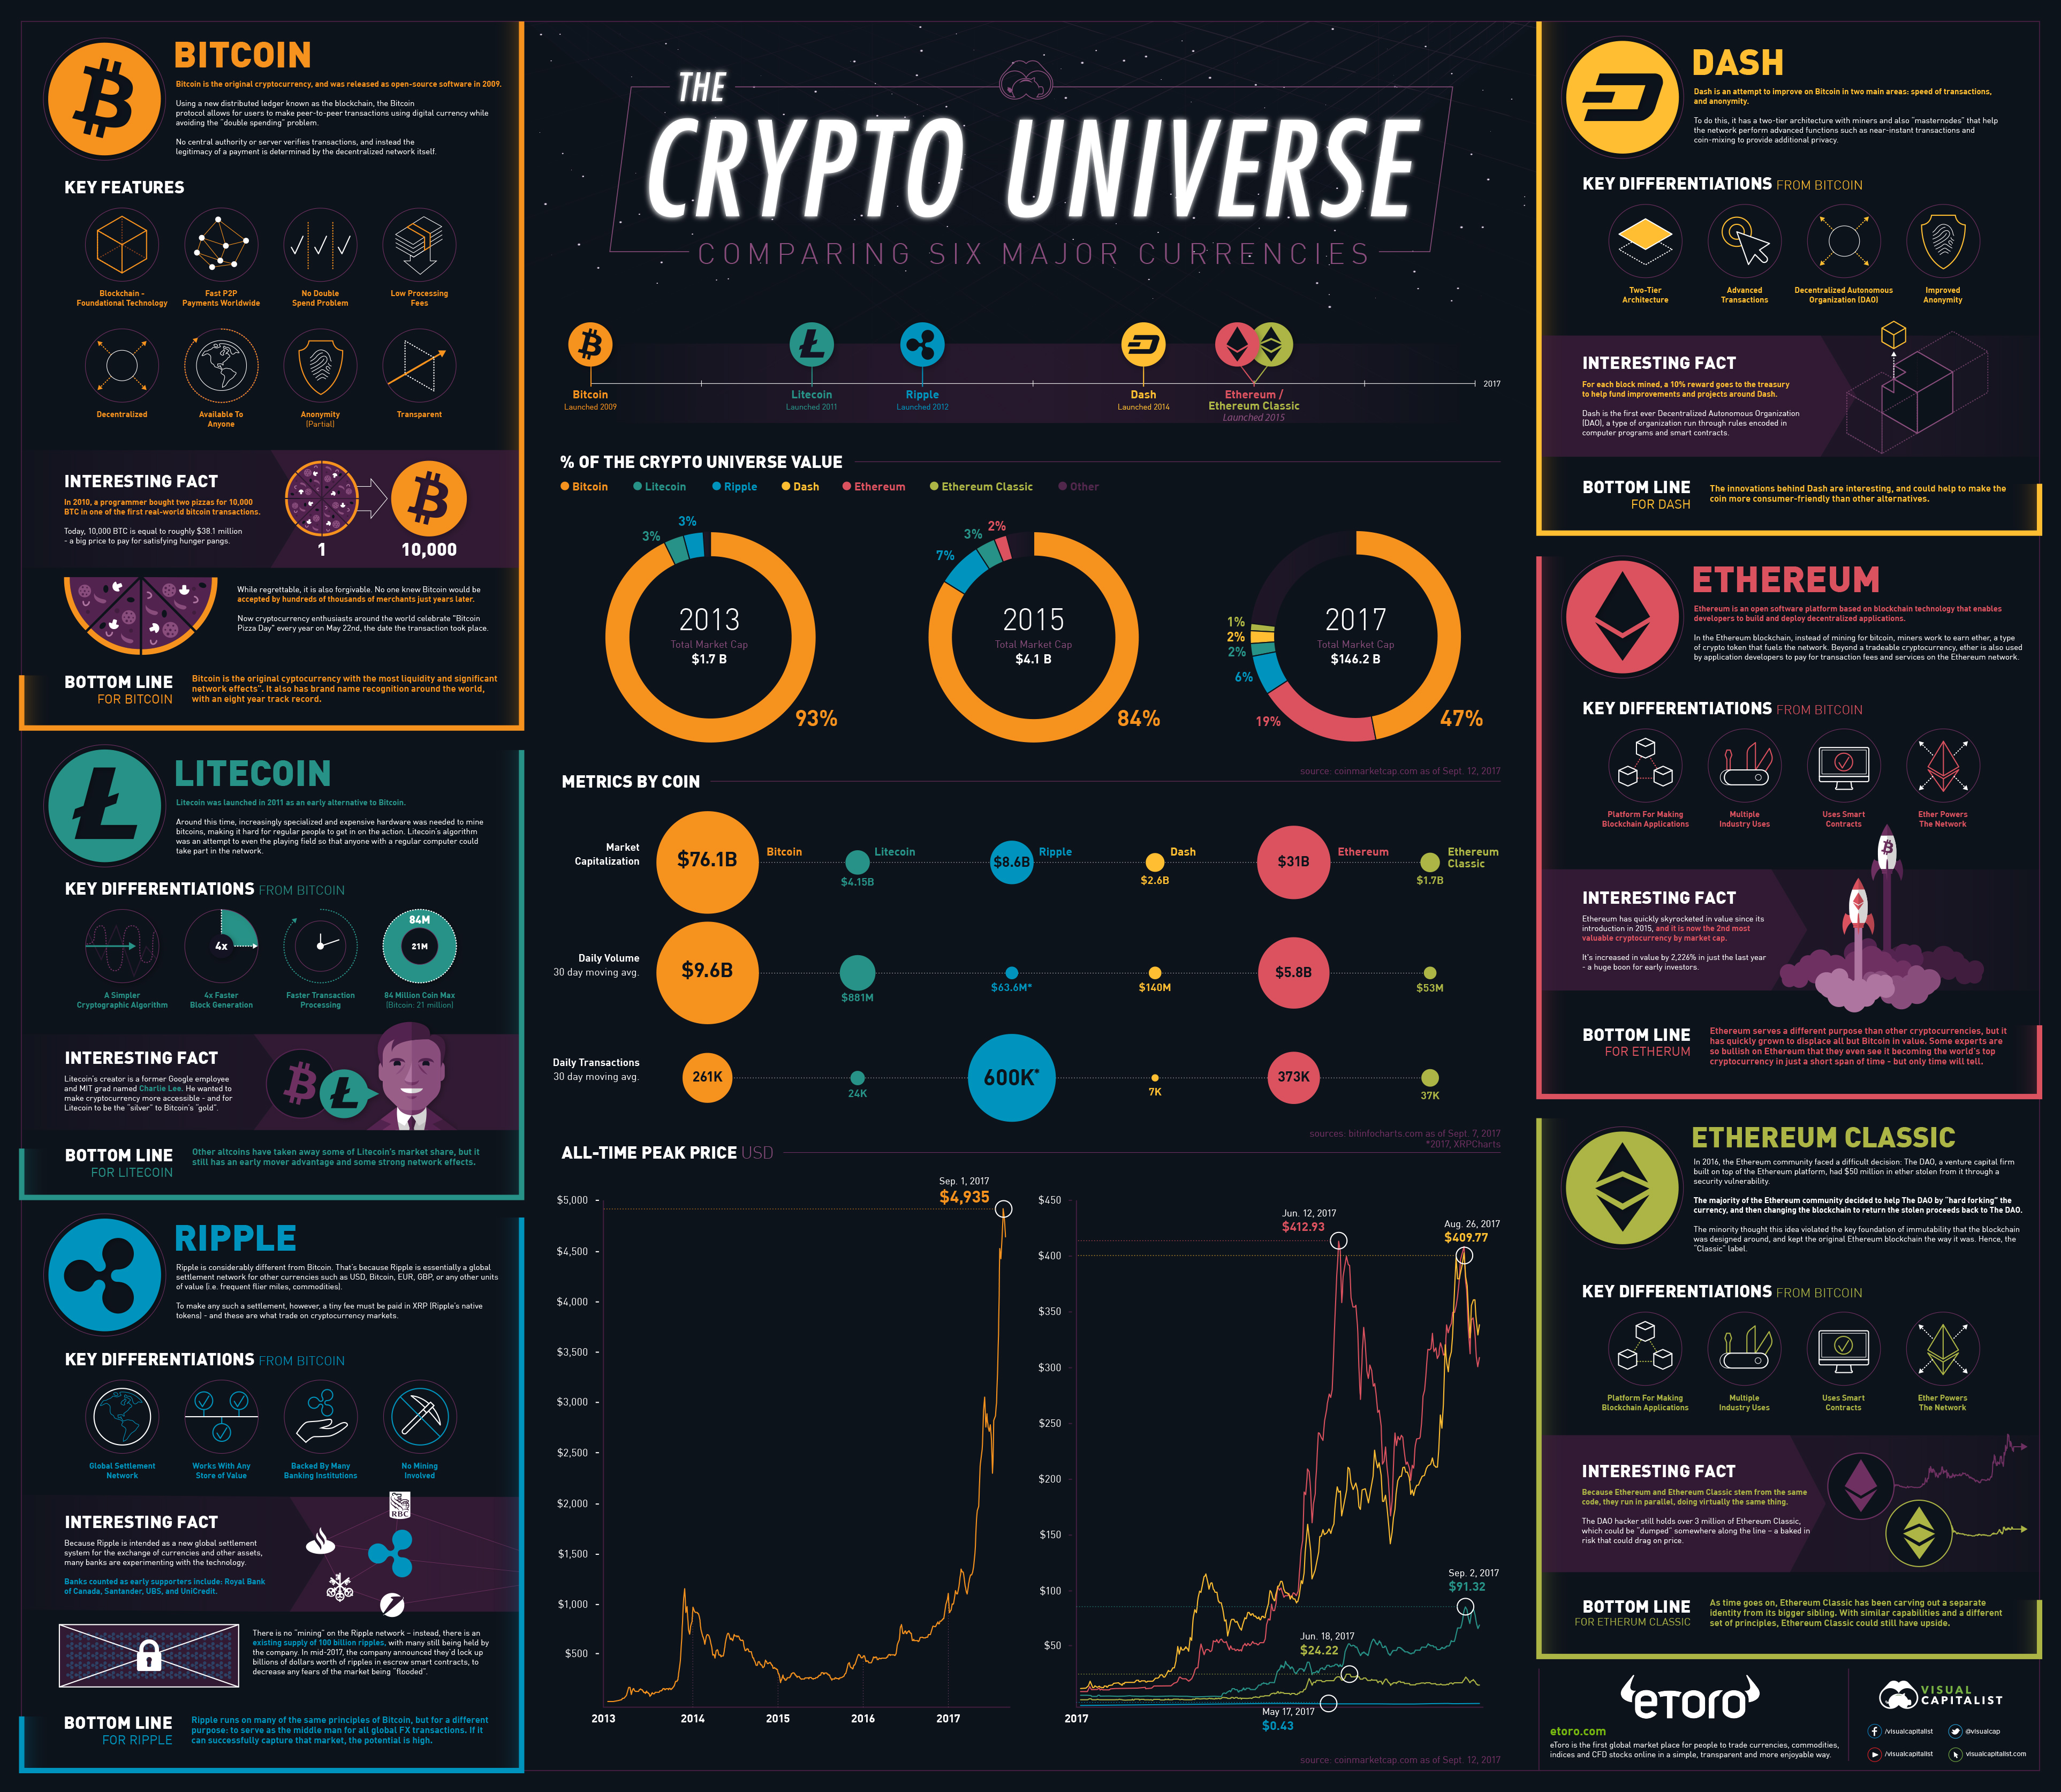
A Description of Major Coins
Here are descriptions of the major cryptocurrencies, which make up 84% of the coin universe.
Bitcoin
Bitcoin is the original cryptocurrency, and was released as open-source software in 2009. Using a new distributed ledger known as the blockchain, the Bitcoin protocol allows for users to make peer-to-peer transactions using digital currency while avoiding the “double spending” problem.
No central authority or server verifies transactions, and instead the legitimacy of a payment is determined by the decentralized network itself.
Bottom Line: Bitcoin is the original cryptocurrency with the most liquidity and significant network effects. It also has brand name recognition around the world, with an eight-year track record.
Litecoin
Litecoin was launched in 2011 as an early alternative to Bitcoin. Around this time, increasingly specialized and expensive hardware was needed to mine bitcoins, making it hard for regular people to get in on the action. Litecoin’s algorithm was an attempt to even the playing field so that anyone with a regular computer could take part in the network.
Bottom Line: Other altcoins have taken away some of Litecoin’s market share, but it still has an early mover advantage and some strong network effects.
Ripple
Ripple is considerably different from Bitcoin. That’s because Ripple is essentially a global settlement network for other currencies such as USD, Bitcoin, EUR, GBP, or any other units of value (i.e. frequent flier miles, commodities).
To make any such a settlement, however, a tiny fee must be paid in XRP (Ripple’s native tokens) – and these are what trade on cryptocurrency markets.
Bottom Line: Ripple runs on many of the same principles of Bitcoin, but for a different purpose: to serve as the middleman for all global FX transactions. If it can successfully capture that market, the potential is high.
Ethereum:
Ethereum is an open software platform based on blockchain technology that enables developers to build and deploy decentralized applications.
In the Ethereum blockchain, instead of mining for bitcoin, miners work to earn ether, a type of crypto token that fuels the network. Beyond a tradeable cryptocurrency, ether is also used by application developers to pay for transaction fees and services on the Ethereum network.
Bottom Line: Ethereum serves a different purpose than other cryptocurrencies, but it has quickly grown to displace all but Bitcoin in value. Some experts are so bullish on Ethereum that they even see it becoming the world’s top cryptocurrency in just a short span of time – but only time will tell.
Ethereum Classic:
In 2016, the Ethereum community faced a difficult decision: The DAO, a venture capital firm built on top of the Ethereum platform, had $50 million in ether stolen from it through a security vulnerability.
The majority of the Ethereum community decided to help The DAO by “hard forking” the currency, and then changing the blockchain to return the stolen proceeds back to The DAO. The minority thought this idea violated the key foundation of immutability that the blockchain was designed around, and kept the original Ethereum blockchain the way it was. Hence, the “Classic” label.
Bottom Line: As time goes on, Ethereum Classic has been carving out a separate identity from its bigger sibling. With similar capabilities and a different set of principles, Ethereum Classic could still have upside.
Dash:
Dash is an attempt to improve on Bitcoin in two main areas: speed of transactions, and anonymity. To do this, it has a two-tier architecture with miners and also “masternodes” that help the network perform advanced functions such as near-instant transactions and coin-mixing to provide additional privacy.
Bottom Line: The innovations behind Dash are interesting, and could help to make the coin more consumer-friendly than other alternatives.
Bonus: Bitcoin Cash
Although not included in the graphic, we also wanted to add a quick word on Bitcoin Cash. This new currency “hard forked” from Bitcoin about a month ago, as a result of miner disagreements about the future of Bitcoin. Here’s a detailed summary of the announcement.


Technology
Countries With the Highest Rates of Crypto Ownership
While the U.S. is a major market for cryptocurrencies, two countries surpass it in terms of their rates of crypto ownership.


Countries With the Highest Rates of Crypto Ownership
This was originally posted on our Voronoi app. Download the app for free on iOS or Android and discover incredible data-driven charts from a variety of trusted sources.
This graphic ranks the top 10 countries by their rate of cryptocurrency ownership, which is the percentage of the population that owns crypto. These figures come from crypto payment gateway, Triple-A, and are as of 2023.
Data and Highlights
The table below lists the rates of crypto ownership in the top 10 countries, as well as the number of people this amounts to.
| Country | % of Population Who Own Crypto | # of Crypto Owners |
|---|---|---|
| 🇦🇪 United Arab Emirates | 30.4 | 3M |
| 🇻🇳 Vietnam | 21.2 | 21M |
| 🇺🇸 U.S. | 15.6 | 53M |
| 🇮🇷 Iran | 13.5 | 12M |
| 🇵🇭 Philippines | 13.4 | 16M |
| 🇧🇷 Brazil | 12 | 26M |
| 🇸🇦 Saudi Arabia | 11.4 | 4M |
| 🇸🇬 Singapore | 11.1 | 665K |
| 🇺🇦 Ukraine | 10.6 | 4M |
| 🇻🇪 Venezuela | 10.3 | 3M |
Note that if we were to rank countries based on their actual number of crypto owners, India would rank first at 93 million people, China would rank second at 59 million people, and the U.S. would rank third at 52 million people.
The UAE Takes the Top Spot
The United Arab Emirates (UAE) boasts the highest rates of crypto ownership globally. The country’s government is considered to be very crypto friendly, as described in Henley & Partners’ Crypto Wealth Report 2023:
In the UAE, the Financial Services Regulatory Authority (FSRA-ADGM) was the first to provide rules and regulations regarding cryptocurrency purchasing and selling. The Emirates are generally very open to new technologies and have proposed zero taxes for crypto owners and businesses.
Vietnam leads Southeast Asia
According to the Crypto Council for Innovation, cryptocurrency holdings in Vietnam are also untaxed, making them an attractive asset.
Another reason for Vietnam’s high rates of ownership could be its large unbanked population (people without access to financial services). Cryptocurrencies may provide an alternative means of accessing these services without relying on traditional banks.
Learn More About Crypto From Visual Capitalist
If you enjoyed this post, be sure to check out The World’s Largest Corporate Holders of Bitcoin, which ranks the top 12 publicly traded companies by their Bitcoin holdings.

-

 Markets6 days ago
Visualized: Interest Rate Forecasts for Advanced Economies
-

 Markets2 weeks ago
Economic Growth Forecasts for G7 and BRICS Countries in 2024
-

 Wealth2 weeks ago
Charted: Which City Has the Most Billionaires in 2024?
-

 Technology2 weeks ago
All of the Grants Given by the U.S. CHIPS Act
-

 Green2 weeks ago
The Carbon Footprint of Major Travel Methods
-

 United States1 week ago
Visualizing the Most Common Pets in the U.S.
-

 Culture1 week ago
The World’s Top Media Franchises by All-Time Revenue
-

 voronoi1 week ago
Best Visualizations of April on the Voronoi App