Markets
Which Countries Have the Most Economic Complexity?
Every country has an economy that is unique.
In some places, such as the United States or Germany, economies are able to produce many different goods and services that get exported around the world. These countries tend to house world-class businesses in sectors like financials, technology, consumer goods, and healthcare, with companies that produce highly specialized goods like automobiles, software, or pharmaceutical products. Ultimately, these are innovative economies that can roll with the punches, creating growth even when prospects are dim.
In other places, this level of sophistication is just not there. Innovation and knowledge are stunted or non-existent for most industries, and these countries may focus exclusively on one or two goods to pay the bills. Venezuela’s reliance on oil is an obvious example of this, but there are even many Western countries that miss the mark here as well.
Measuring Economic Complexity
In 2009, a team at Harvard formalized a measure of economic complexity that compared nations based on the sophistication of their economies. Now known as the Economic Complexity Index (ECI), the exact measurement is complicated, but it essentially uses data on two main things to uncover the underlying level of economic complexity:
1. Economic Diversity
Measures how many different products a country can produce.
2. Economic Ubiquity
Measures how many countries are able to make those products.
In other words: if a country produces only a few goods, that economy is not very complex. Further, if a country produces many different products, but they are all simple ones that can be replicated elsewhere, the economy is still not complex. See full details on the project here.
Ranking the Most Complex Economies
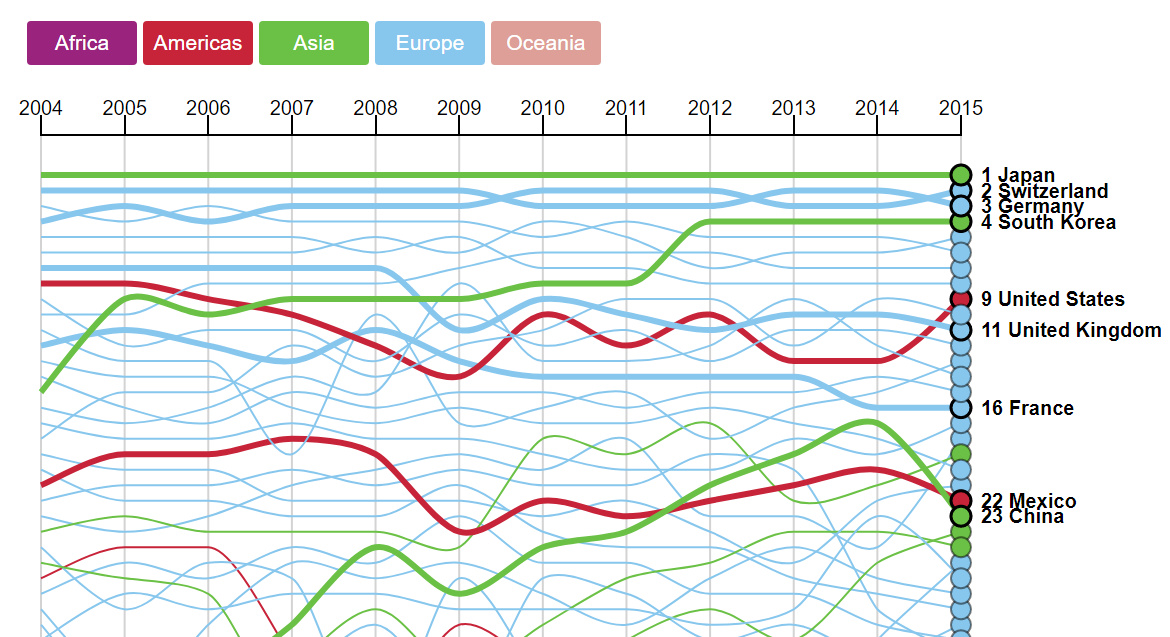
Here are the most complex economies in order, along with the changing rankings over time:
As you’ll notice, the most recent set of data is from 2015.
Topping the list are the economies of Japan (1st), Switzerland (2nd), Germany (3rd), and South Korea (4th). The United States sits in 9th place, and Canada is further down at 33rd.
Australia, which relies heavily on commodities, ranks notably low for Western countries in 73rd place, where it is sandwiched between Kazakhstan and the Dominican Republic.
Movers and Shakers
The most recent iteration of the index also highlighted some movers and shakers over the last 10 year period:
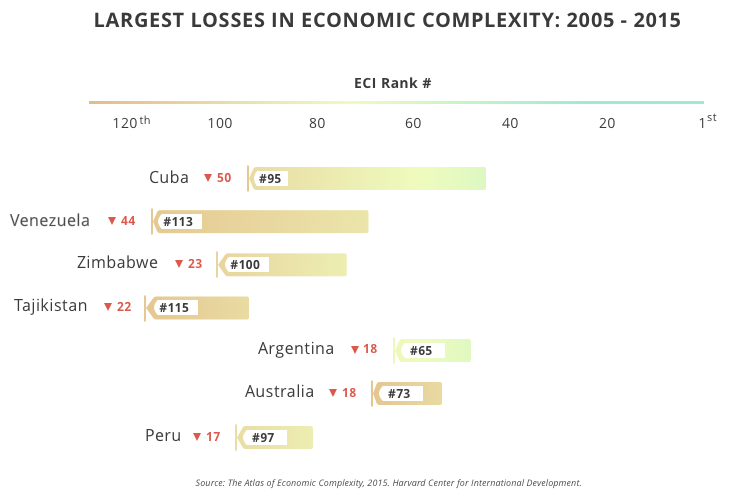
In particular, the crisis in Venezuela has had an effect on economic complexity, eroding any sophistication that existed.
Meanwhile, Cuba’s economy is also in the decline in terms of sophistication – and with major exports including raw sugar (27%), rolled tobacco (15%), nickel (12%), oil (11%), hard liquor (7%), and crustaceans (4%), it’s not hard to see why.
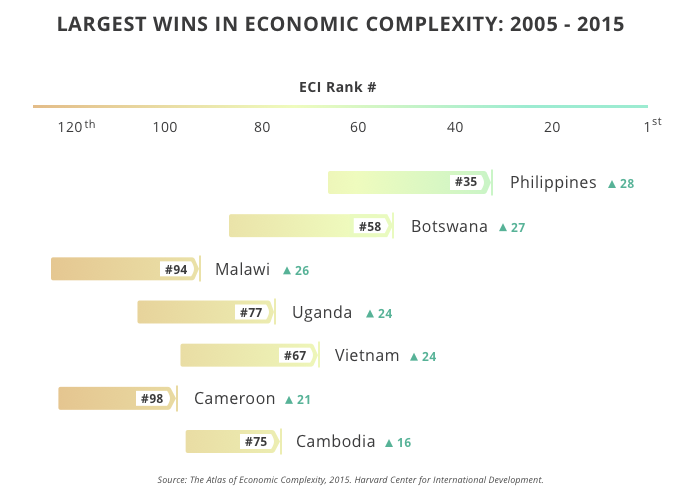
On the opposite side of the spectrum, the Philippines is the biggest mover upwards, ascending 28 spots.
Some African countries are also moving fast up the rankings: Botswana, Malawi, Uganda, and Cameroon each jumped over 20 spots.


Economy
Economic Growth Forecasts for G7 and BRICS Countries in 2024
The IMF has released its economic growth forecasts for 2024. How do the G7 and BRICS countries compare?


G7 & BRICS Real GDP Growth Forecasts for 2024
The International Monetary Fund’s (IMF) has released its real gross domestic product (GDP) growth forecasts for 2024, and while global growth is projected to stay steady at 3.2%, various major nations are seeing declining forecasts.
This chart visualizes the 2024 real GDP growth forecasts using data from the IMF’s 2024 World Economic Outlook for G7 and BRICS member nations along with Saudi Arabia, which is still considering an invitation to join the bloc.
Get the Key Insights of the IMF’s World Economic Outlook
Want a visual breakdown of the insights from the IMF’s 2024 World Economic Outlook report?
This visual is part of a special dispatch of the key takeaways exclusively for VC+ members.
Get the full dispatch of charts by signing up to VC+.
Mixed Economic Growth Prospects for Major Nations in 2024
Economic growth projections by the IMF for major nations are mixed, with the majority of G7 and BRICS countries forecasted to have slower growth in 2024 compared to 2023.
Only three BRICS-invited or member countries, Saudi Arabia, the UAE, and South Africa, have higher projected real GDP growth rates in 2024 than last year.
| Group | Country | Real GDP Growth (2023) | Real GDP Growth (2024P) |
|---|---|---|---|
| G7 | 🇺🇸 U.S. | 2.5% | 2.7% |
| G7 | 🇨🇦 Canada | 1.1% | 1.2% |
| G7 | 🇯🇵 Japan | 1.9% | 0.9% |
| G7 | 🇫🇷 France | 0.9% | 0.7% |
| G7 | 🇮🇹 Italy | 0.9% | 0.7% |
| G7 | 🇬🇧 UK | 0.1% | 0.5% |
| G7 | 🇩🇪 Germany | -0.3% | 0.2% |
| BRICS | 🇮🇳 India | 7.8% | 6.8% |
| BRICS | 🇨🇳 China | 5.2% | 4.6% |
| BRICS | 🇦🇪 UAE | 3.4% | 3.5% |
| BRICS | 🇮🇷 Iran | 4.7% | 3.3% |
| BRICS | 🇷🇺 Russia | 3.6% | 3.2% |
| BRICS | 🇪🇬 Egypt | 3.8% | 3.0% |
| BRICS-invited | 🇸🇦 Saudi Arabia | -0.8% | 2.6% |
| BRICS | 🇧🇷 Brazil | 2.9% | 2.2% |
| BRICS | 🇿🇦 South Africa | 0.6% | 0.9% |
| BRICS | 🇪🇹 Ethiopia | 7.2% | 6.2% |
| 🌍 World | 3.2% | 3.2% |
China and India are forecasted to maintain relatively high growth rates in 2024 at 4.6% and 6.8% respectively, but compared to the previous year, China is growing 0.6 percentage points slower while India is an entire percentage point slower.
On the other hand, four G7 nations are set to grow faster than last year, which includes Germany making its comeback from its negative real GDP growth of -0.3% in 2023.
Faster Growth for BRICS than G7 Nations
Despite mostly lower growth forecasts in 2024 compared to 2023, BRICS nations still have a significantly higher average growth forecast at 3.6% compared to the G7 average of 1%.
While the G7 countries’ combined GDP is around $15 trillion greater than the BRICS nations, with continued higher growth rates and the potential to add more members, BRICS looks likely to overtake the G7 in economic size within two decades.
BRICS Expansion Stutters Before October 2024 Summit
BRICS’ recent expansion has stuttered slightly, as Argentina’s newly-elected president Javier Milei declined its invitation and Saudi Arabia clarified that the country is still considering its invitation and has not joined BRICS yet.
Even with these initial growing pains, South Africa’s Foreign Minister Naledi Pandor told reporters in February that 34 different countries have submitted applications to join the growing BRICS bloc.
Any changes to the group are likely to be announced leading up to or at the 2024 BRICS summit which takes place October 22-24 in Kazan, Russia.
Get the Full Analysis of the IMF’s Outlook on VC+
This visual is part of an exclusive special dispatch for VC+ members which breaks down the key takeaways from the IMF’s 2024 World Economic Outlook.
For the full set of charts and analysis, sign up for VC+.

-

 Markets1 week ago
U.S. Debt Interest Payments Reach $1 Trillion
-

 Markets2 weeks ago
Ranked: The Most Valuable Housing Markets in America
-

 Money2 weeks ago
Which States Have the Highest Minimum Wage in America?
-

 AI2 weeks ago
Ranked: Semiconductor Companies by Industry Revenue Share
-

 Markets2 weeks ago
Ranked: The World’s Top Flight Routes, by Revenue
-

 Countries2 weeks ago
Population Projections: The World’s 6 Largest Countries in 2075
-

 Markets2 weeks ago
The Top 10 States by Real GDP Growth in 2023
-

 Money2 weeks ago
The Smallest Gender Wage Gaps in OECD Countries