Misc
Here’s How Americans Spend Their Time, Sorted by Income
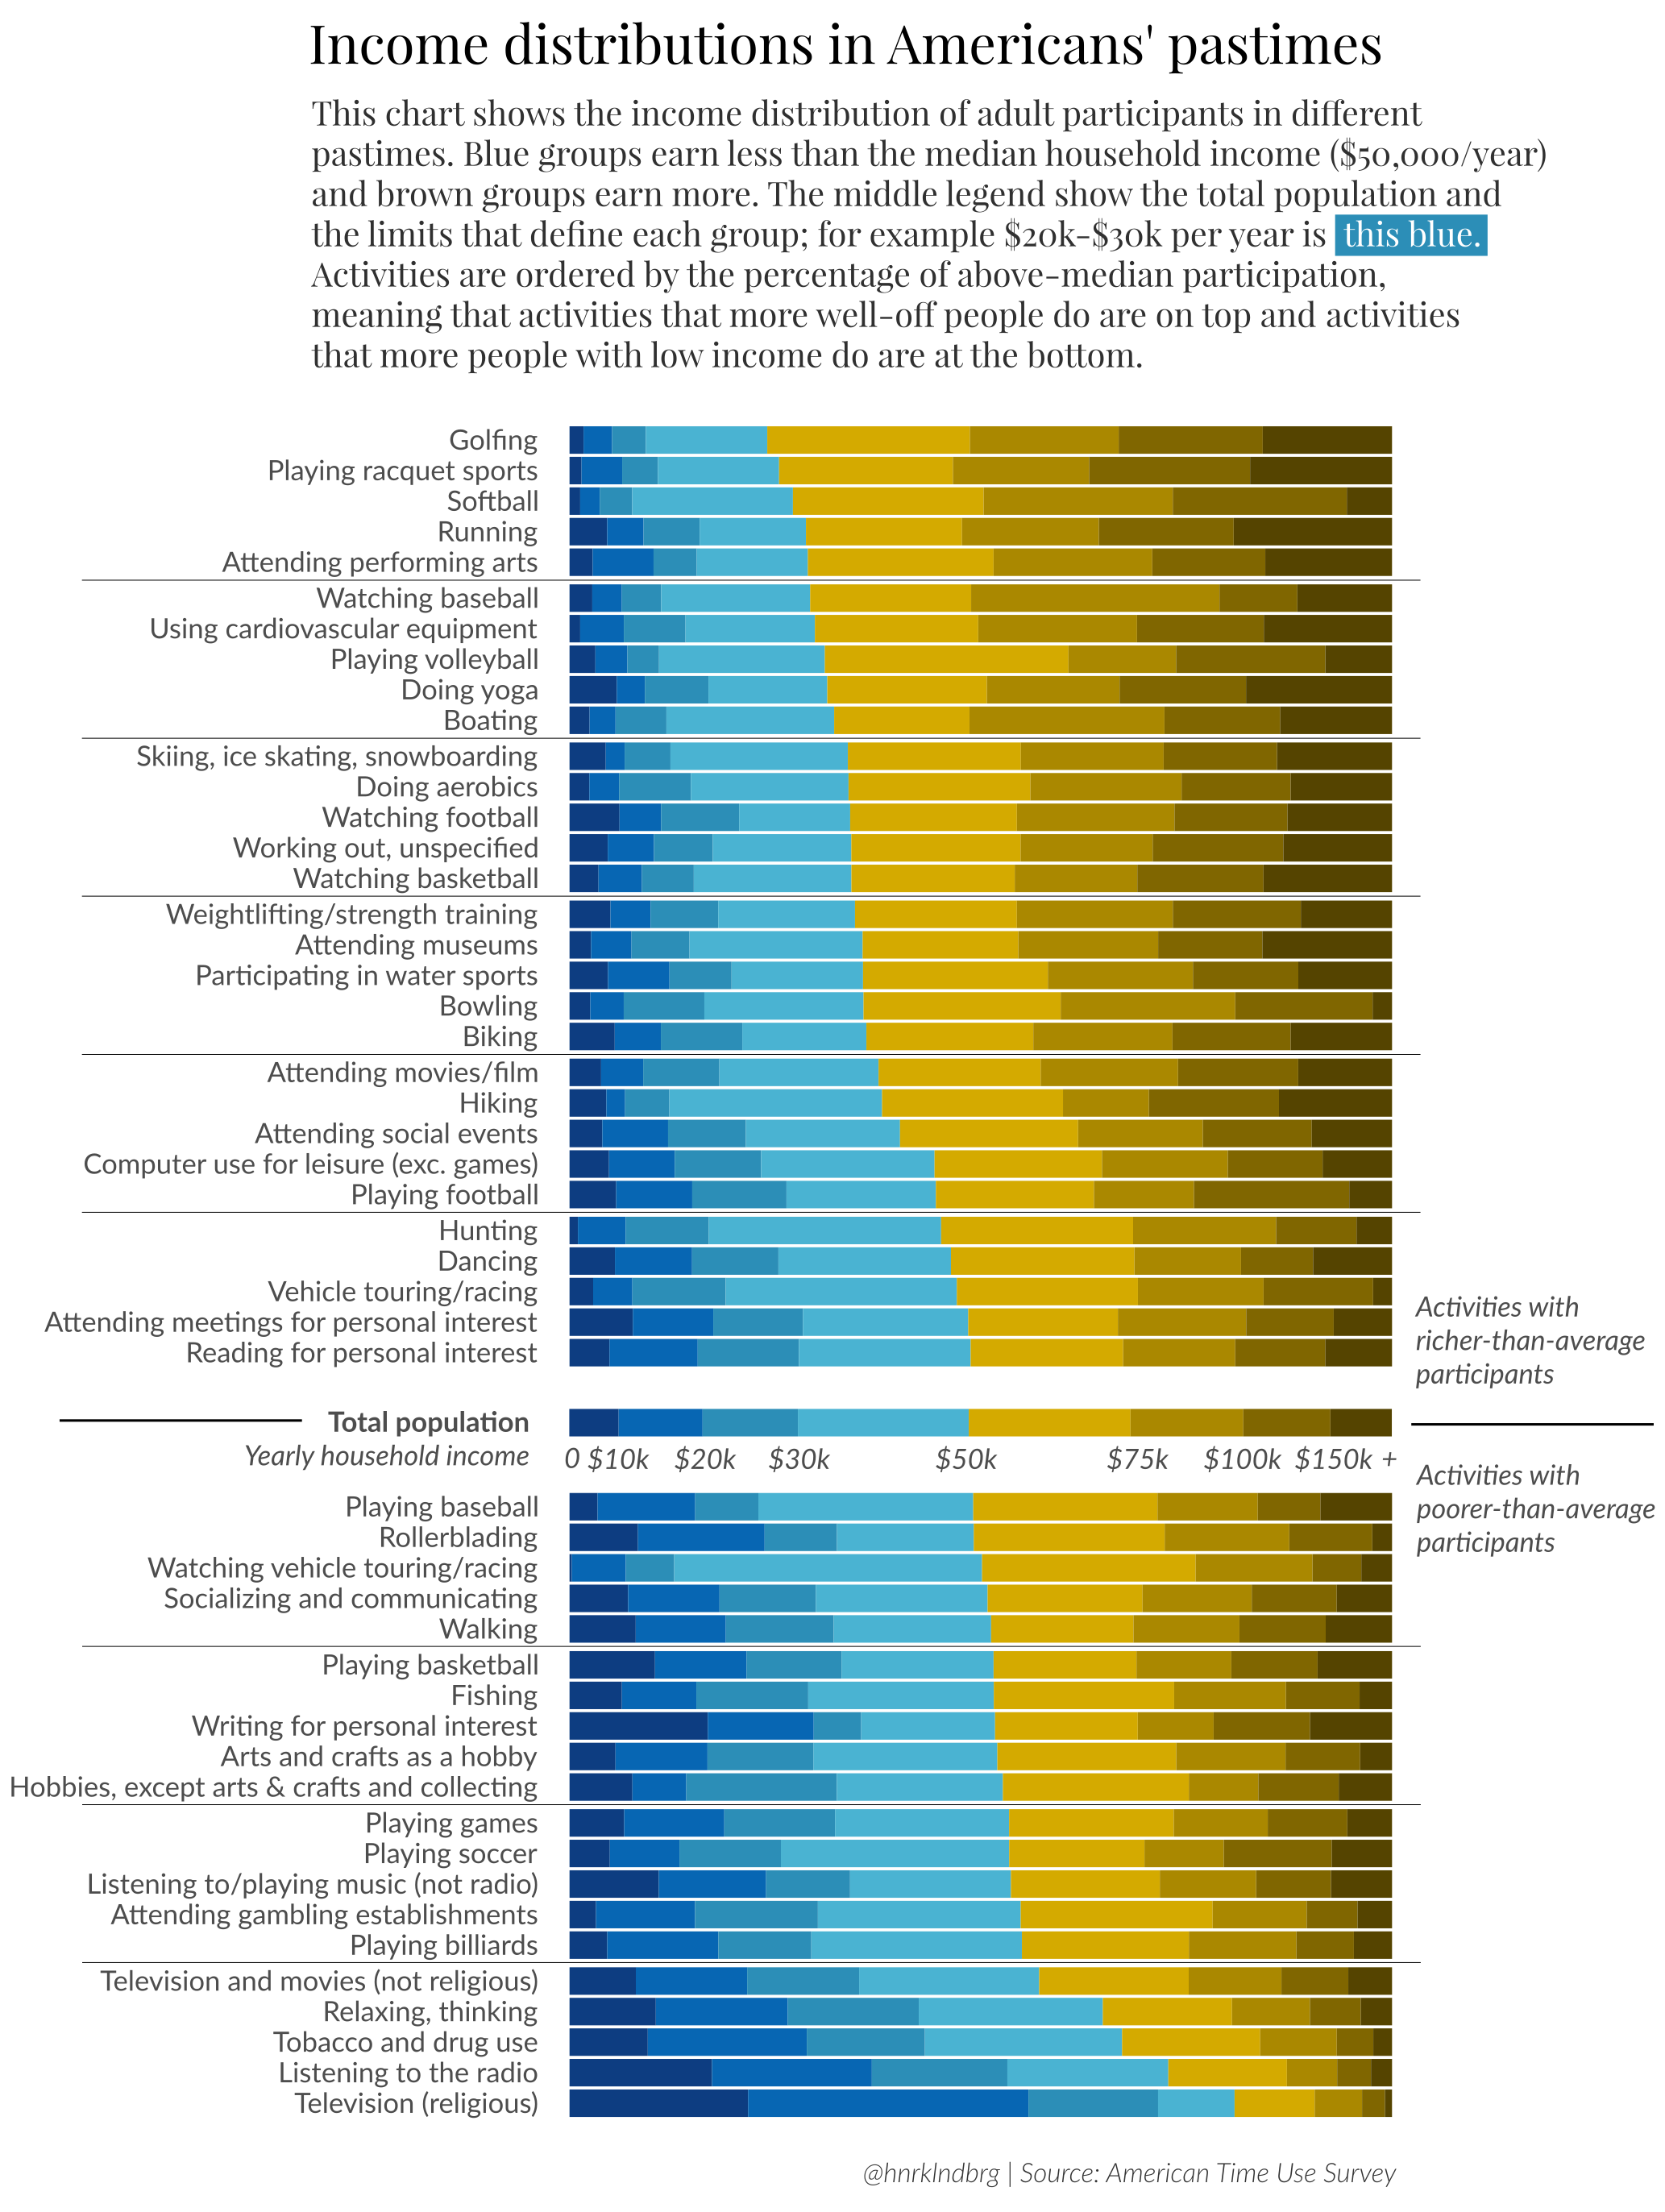
Today’s visualization comes from data scientist Henrik Lindberg, and it shows America’s favorite past-times based on the participation of people in different income brackets.
It uses data from the American Time Use Survey that is produced by the Bureau of Labor Statistics (BLS) to break down these activities.
Common Interests
While activities are all over the map, it appears that some past-times are more common across all income groups.
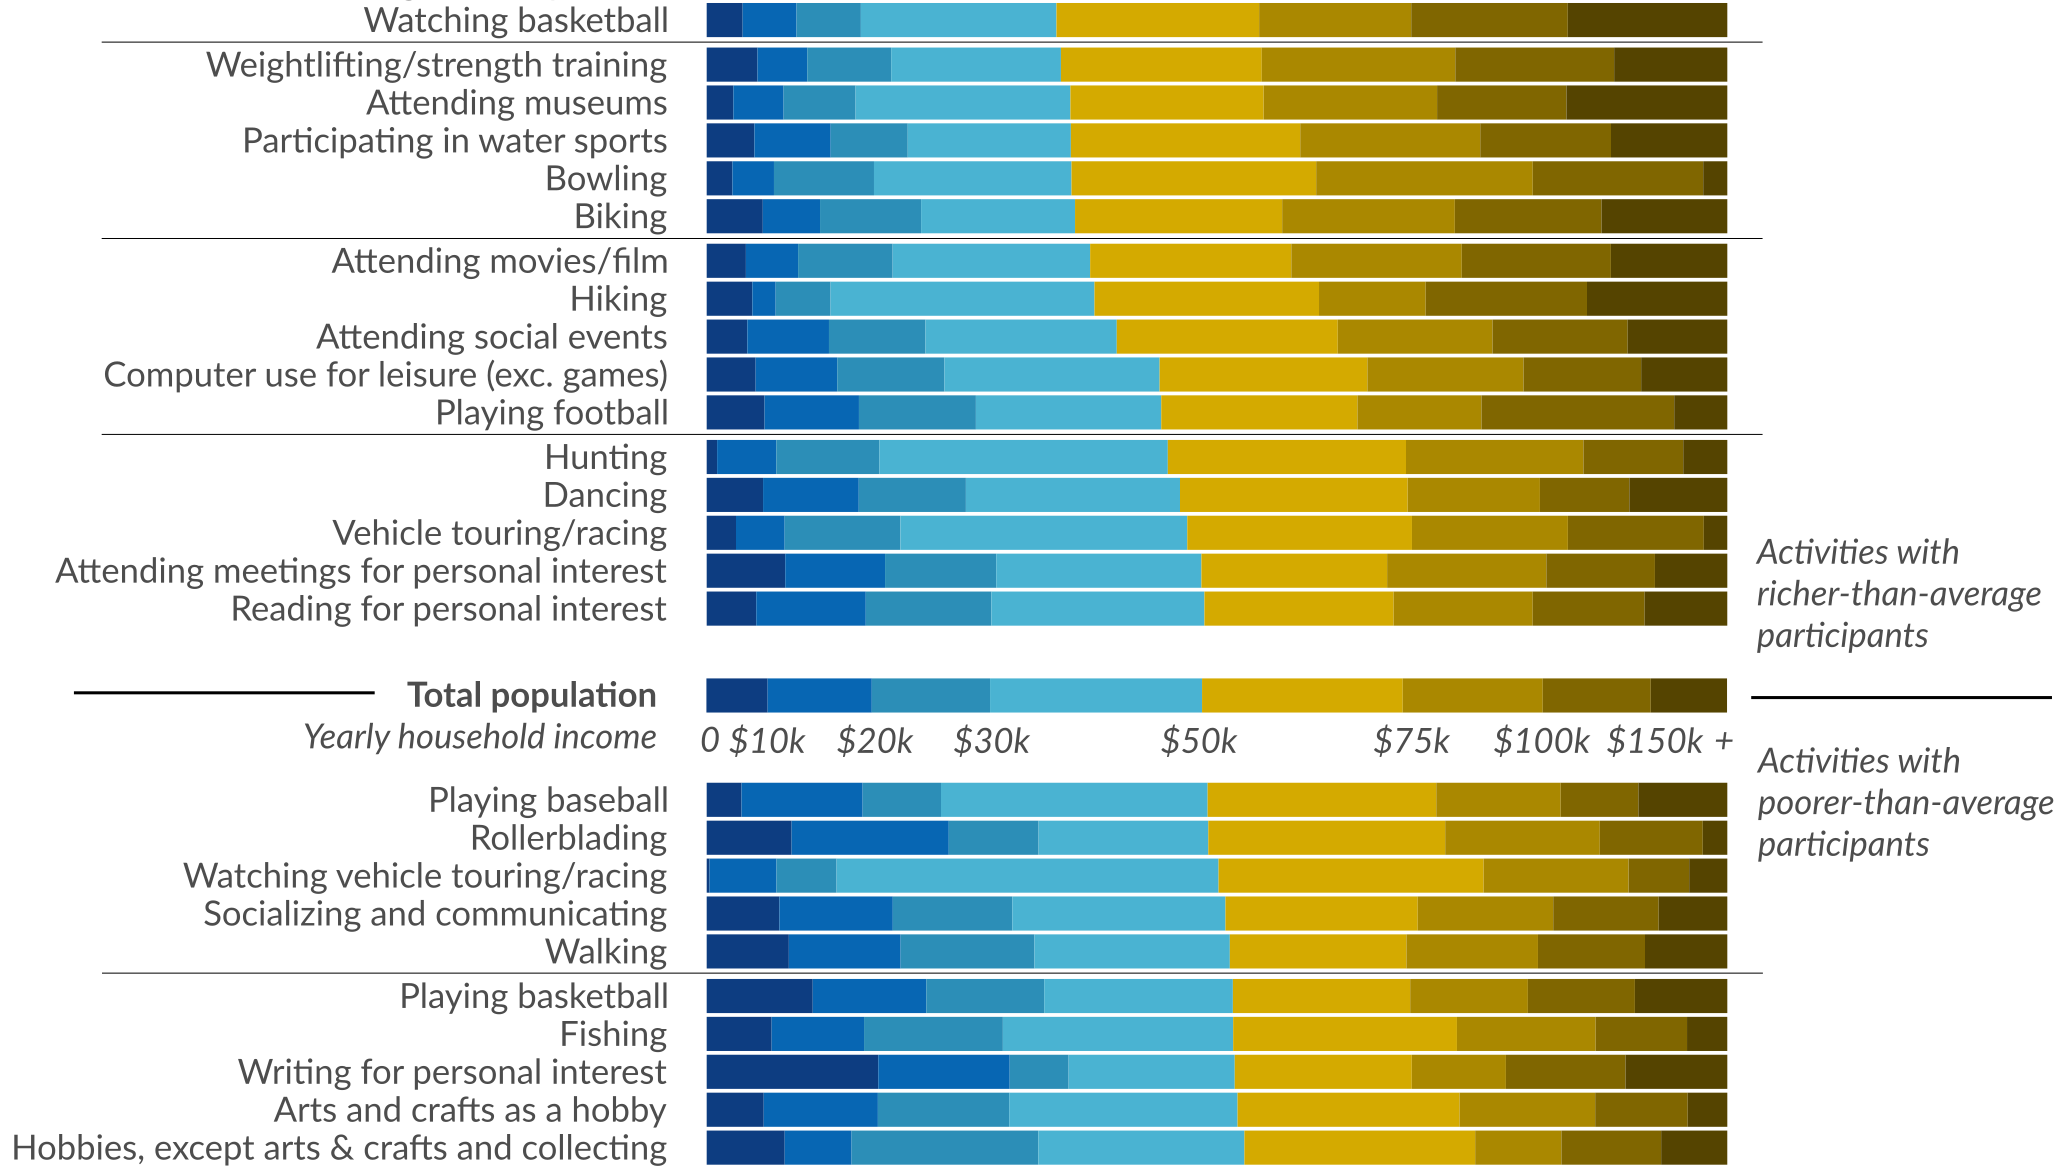
Team sports and solo pursuits both are represented well in the center. In fact, reading for personal interest, dancing, computer use, hunting, hiking, walking, playing basketball, or playing baseball can all be found in the middle of the spectrum, appealing to Americans in every income group.
Closer to the top and bottom of the visualization, however, we see where income groups diverge in how they spend their time. It’s probably not surprising to see that people with higher incomes spend more time golfing, playing racket sports, attending performing arts, and doing yoga than average. On the flipside, lower income Americans spend more time watching television, listening to the radio, and listening to/playing music.
Curious Anomalies
Every data set has its own peculiarities. Sometimes these things can be explained, and sometimes they are just aberrations created as a result of how data was collected (i.e. how a survey was worded, bias, or some other error).
Here are some of the stranger anomalies that appear in this data set. We won’t attempt to explain them here, but feel free to speculate in the comments section:
- Higher income Americans disproportionately enjoy softball – while baseball has more universal appeal across income groups.
- While activities like boating are typically associated with higher income levels, the activity of running is generally not. Yet, running is disproportionately enjoyed by higher income Americans, according to this survey.
- Despite playing baseball being fairly universal across the spectrum, watching baseball skews higher income.
- Writing for personal interest has an interesting distribution: it is enjoyed disproportionately by poorer and richer Americans, but is underrepresented in the middle class.
Can you find anything else that stands out as being an anomaly?


Politics
Charted: Trust in Government Institutions by G7 Countries
How much do you trust the government and its various institutions? We look at data for G7 countries for the time period of 2006-2023.


Trust in Government Institutions by G7 Countries
This was originally posted on our Voronoi app. Download the app for free on iOS or Android and discover incredible data-driven charts from a variety of trusted sources.
How much do you trust the government, and its various institutions?
It’s likely that your level of confidence probably depends on a wide range of factors, such as perceived competency, historical context, economic performance, accountability, social cohesion, and transparency.
And for these same reasons, trust levels in government institutions also change all the time, even in the world’s most developed countries: the G7.
Confidence in Government by G7 Countries (2006-2023)
This chart looks at the changes in trust in government institutions between the years 2006 and 2023, based on data from a multi-country Gallup poll.
Specifically, this dataset aggregates confidence in multiple national institutions, including the military, the judicial system, the national government, and the integrity of the electoral system.
| Country | Confidence (2006) | Confidence (2023) | Change (p.p.) |
|---|---|---|---|
| Canada | 57% | 64% | +7 |
| Britain | 63% | 63% | +0 |
| Germany | 55% | 61% | +6 |
| France | 54% | 60% | +6 |
| Japan | 48% | 59% | +11 |
| Italy | 41% | 54% | +13 |
| United States | 63% | 50% | -13 |
What’s interesting here is that in the G7, a group of the world’s most developed economies, there is only one country bucking the general trend: the United States.
Across most G7 countries, confidence in institutions has either improved or stayed the same between 2006 and 2023. The largest percentage point (p.p.) increases occur in Italy and Japan, which saw +13 p.p. and +11 p.p. increases in trust over the time period.
In the U.S., however, confidence in government institutions has fallen by 13 p.p. over the years. What happened?
Key Figures on U.S. Trust in Institutions
In 2006, the U.S. was tied with the UK as having the highest confidence in government institutions, at 63%.
But here’s where the scores stand in 2023, across various institutions:
| 🇺🇸 Institutions | Confidence (2023) |
|---|---|
| Military | 81% |
| Judiciary | 42% |
| National Government | 30% |
| Elections | 44% |
| Overall | 49% |
Based on this data, it’s clear that the U.S. lags behind in three key indicators: confidence in the national government, confidence in the justice system, and confidence in fair elections. It ranked in last place for each indicator in the G7.
One other data point that stands out: despite leading the world in military spending, the U.S. is only the third most confident in its military in the G7. It lags behind France (86%) and the United Kingdom (83%).

-

 Wealth6 days ago
Charted: Which City Has the Most Billionaires in 2024?
-

 Mining2 weeks ago
Gold vs. S&P 500: Which Has Grown More Over Five Years?
-

 Uranium2 weeks ago
The World’s Biggest Nuclear Energy Producers
-

 Education2 weeks ago
How Hard Is It to Get Into an Ivy League School?
-

 Debt2 weeks ago
How Debt-to-GDP Ratios Have Changed Since 2000
-

 Sports2 weeks ago
The Highest Earning Athletes in Seven Professional Sports
-

 Science2 weeks ago
Visualizing the Average Lifespans of Mammals
-

 Brands1 week ago
How Tech Logos Have Evolved Over Time