Markets
Mapped: The Salary Needed to Buy a Home in 50 U.S. Metro Areas
Check out the latest 2023 update of the salary needed to buy a home in the U.S.
The Salary Needed to Buy a Home in 50 U.S. Metro Areas
Check out the latest 2023 update of the salary needed to buy a home in the U.S.
Over the last year, home prices have risen in 49 of the biggest 50 metro areas in the United States.
At the same time, mortgage rates have hit seven-year highs, making things more expensive for any prospective home buyer.
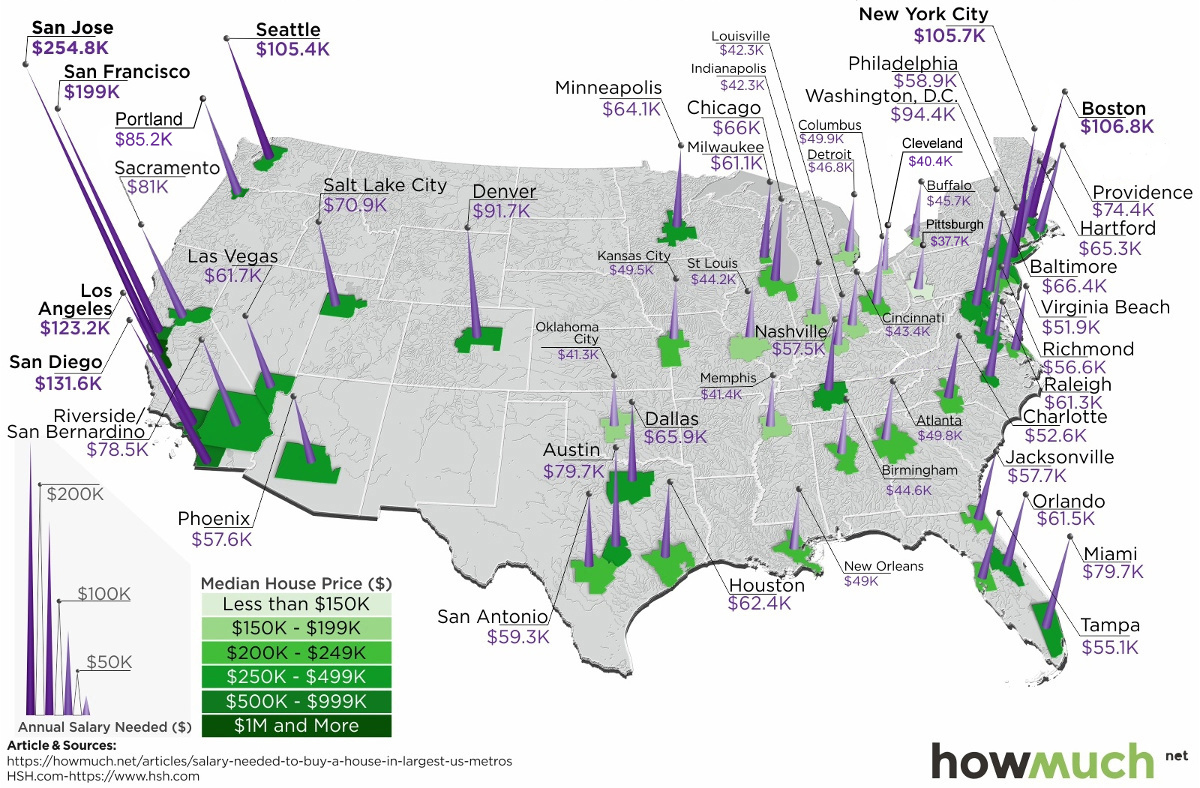
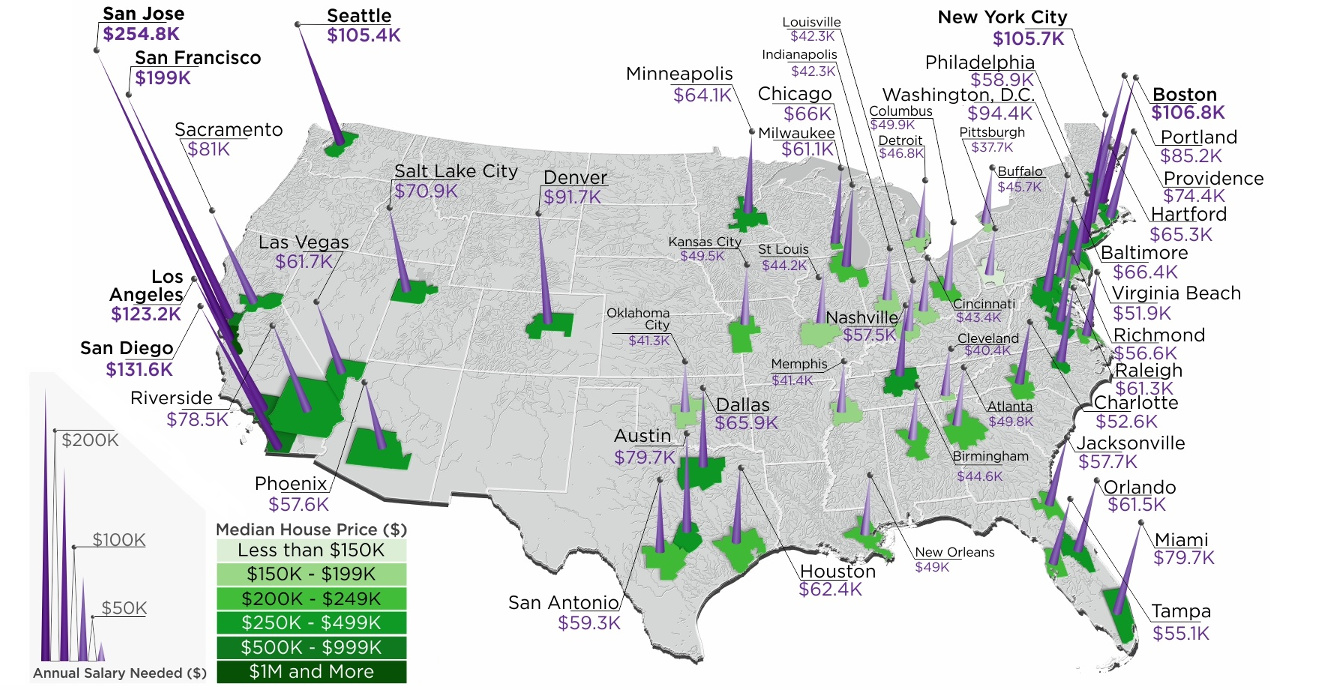
With this context in mind, today’s map comes from HowMuch.net, and it shows the salary needed to buy a home in the 50 largest U.S. metro areas.
The Least and Most Expensive Metro Areas
As a reference point, the median home in the United States costs about $257,600, according to the National Association of Realtors.
| Median Home Price | Montly Payment (PITI) | Salary Needed | |
|---|---|---|---|
| National | $257,600 | $1,433.91 | $61,453.51 |
With a 20% down payment and a 4.90% mortgage rate, and taking into account what’s needed to pay principal, interest, taxes, and insurance (PITI) on the home, it would mean a prospective buyer would need to have $61,453.51 in salary to afford such a purchase.
However, based on your frame of reference, this national estimate may seem extremely low or quite high. That’s because the salary required to buy in different major cities in the U.S. can fall anywhere between $37,659 to $254,835.
The 10 Cheapest Metro Areas
Here are the cheapest metro areas in the U.S., based on data and calculations from HSH.com:
| Rank | Metro Area | Median Home Price | Monthly Payment (PITI) | Salary Needed |
|---|---|---|---|---|
| #1 | Pittsburgh | $141,625 | $878.73 | $37,659.86 |
| #2 | Cleveland | $150,100 | $943.55 | $40,437.72 |
| #3 | Oklahoma City | $161,000 | $964.49 | $41,335.41 |
| #4 | Memphis | $174,000 | $966.02 | $41,400.93 |
| #5 | Indianapolis | $185,200 | $986.74 | $42,288.92 |
| #6 | Louisville | $180,100 | $987.54 | $42,323.15 |
| #7 | Cincinnati | $169,400 | $1,013.37 | $43,429.97 |
| #8 | St. Louis | $174,100 | $1,031.70 | $44,215.56 |
| #9 | Birmingham | $202,300 | $1,040.51 | $44,593.35 |
| #10 | Buffalo | $154,200 | $1,066.29 | $45,698.05 |
After the dust settles, Pittsburgh ranks as the cheapest metro area in the U.S. to buy a home. According to these calculations, buying a median home in Pittsburgh – which includes the surrounding metro area – requires an annual income of less than $40,000 to buy.
Just missing the list was Detroit, where a salary of $48,002.89 is needed.
The 10 Most Expensive Metro Areas
Now, here are the priciest markets in the country, also based on data from HSH.com:
| Rank | Metro Area | Median Home Price | Monthly Payment (PITI) | Salary Needed |
|---|---|---|---|---|
| #1 | San Jose | $1,250,000 | $5,946.17 | $254,835.73 |
| #2 | San Francisco | $952,200 | $4,642.82 | $198,978.01 |
| #3 | San Diego | $626,000 | $3,071.62 | $131,640.79 |
| #4 | Los Angeles | $576,100 | $2,873.64 | $123,156.01 |
| #5 | Boston | $460,300 | $2,491.76 | $106,789.93 |
| #6 | New York City | $403,900 | $2,465.97 | $105,684.33 |
| #7 | Seattle | $489,600 | $2,458.58 | $105,367.89 |
| #8 | Washington, D.C. | $417,400 | $2,202.87 | $94,408.70 |
| #9 | Denver | $438,300 | $2,139.02 | $91,672.45 |
| #10 | Portland | $389,000 | $1,987.37 | $85,173.08 |
Topping the list of the most expensive metro areas are San Jose and San Francisco, which are both cities fueled by the economic boom in Silicon Valley. Meanwhile, two other major metro areas in California, Los Angeles and San Diego, are not far behind.
New York City only ranks in sixth here, though it is worth noting that the NYC metro area extends well beyond the five boroughs. It includes Newark, Jersey City, and many nearby counties as well.
As a final point, it’s worth mentioning that all cities here (with the exception of Denver) are in coastal states.
Notes on Calculations
Data on median home prices comes from the National Association of Realtors and is based on 2018 Q4 information, while national mortgage rate data is derived from weekly surveys by Freddie Mac and the Mortgage Bankers Association of America for 30-year fixed rate mortgages.
Calculations include tax and homeowners insurance costs to determine the annual salary it takes to afford the base cost of owning a home (principal, interest, property tax and homeowner’s insurance, or PITI) in the nation’s 50 largest metropolitan areas.
Standard 28% “front-end” debt ratios and a 20% down payments subtracted from the median-home-price data are used to arrive at these figures.


Economy
The Most Valuable Companies in Major EU Economies
From semiconductor equipment manufacturers to supercar makers, the EU’s most valuable companies run the gamut of industries.
Most Valuable Companies in the EU, by Country
This was originally posted on our Voronoi app. Download the app for free on iOS or Android and discover incredible data-driven charts from a variety of trusted sources.
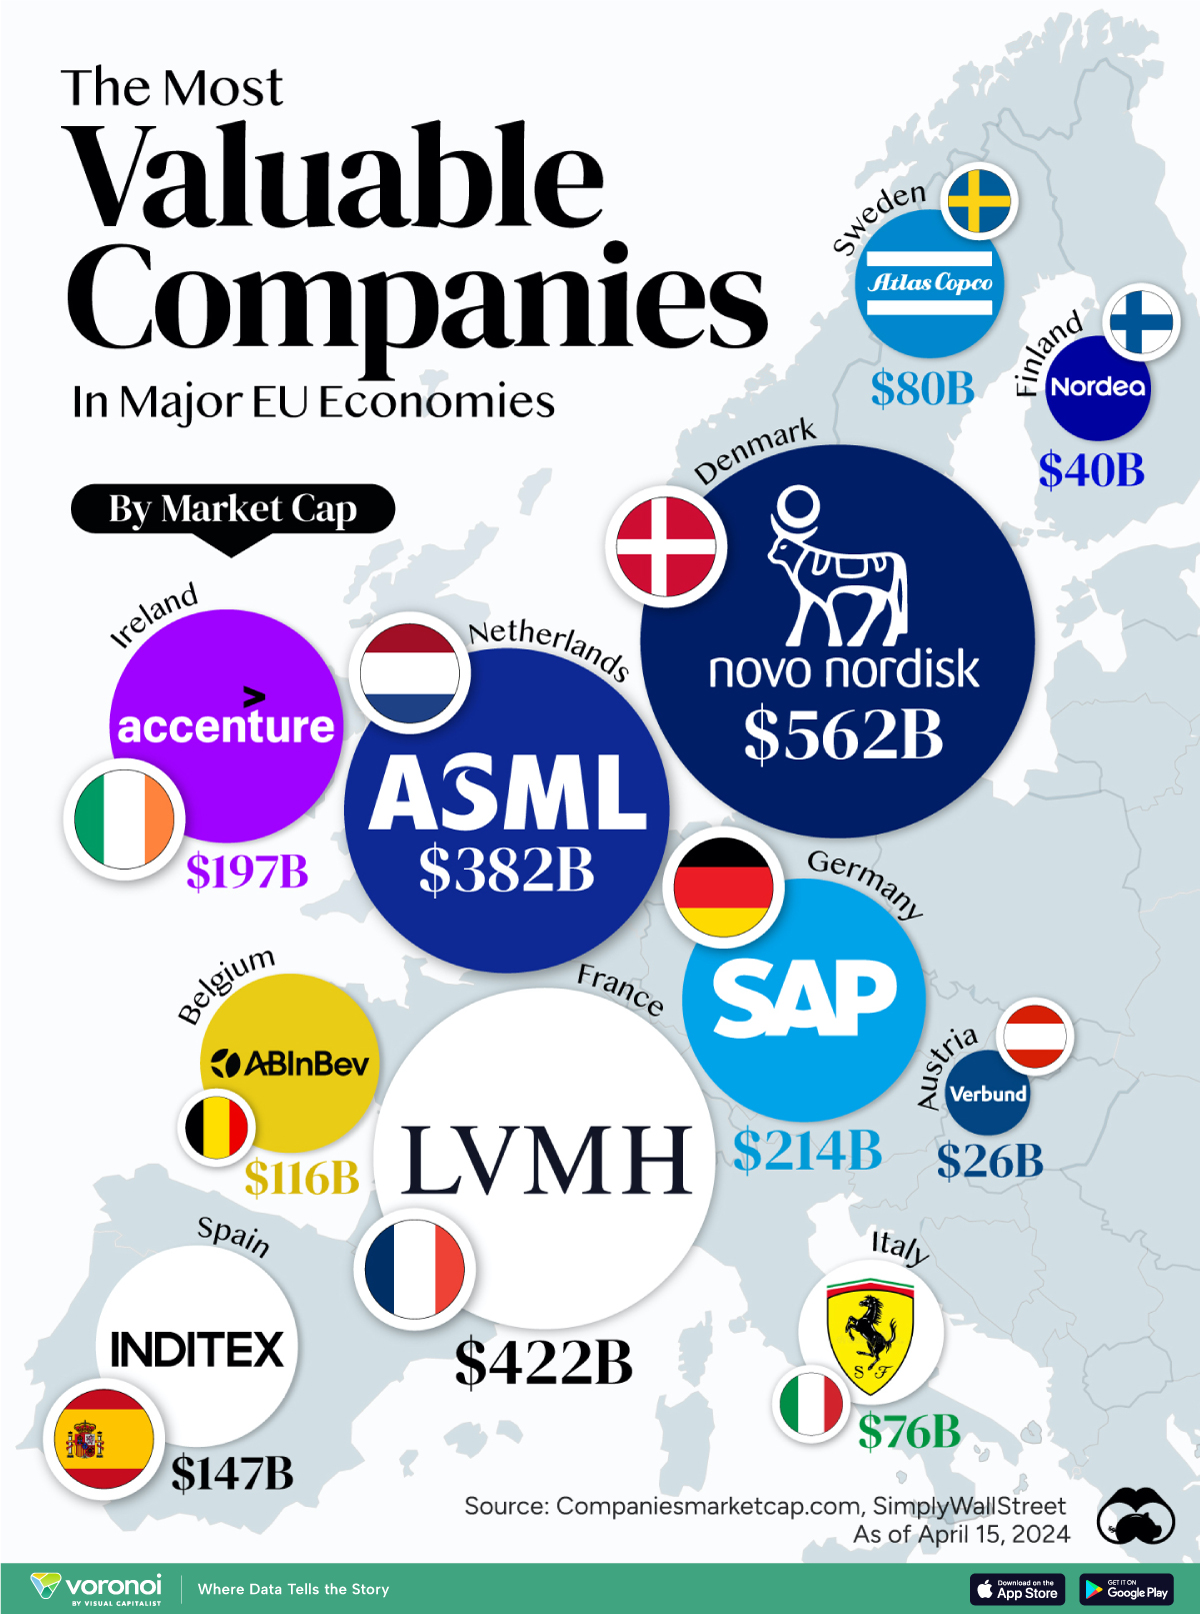
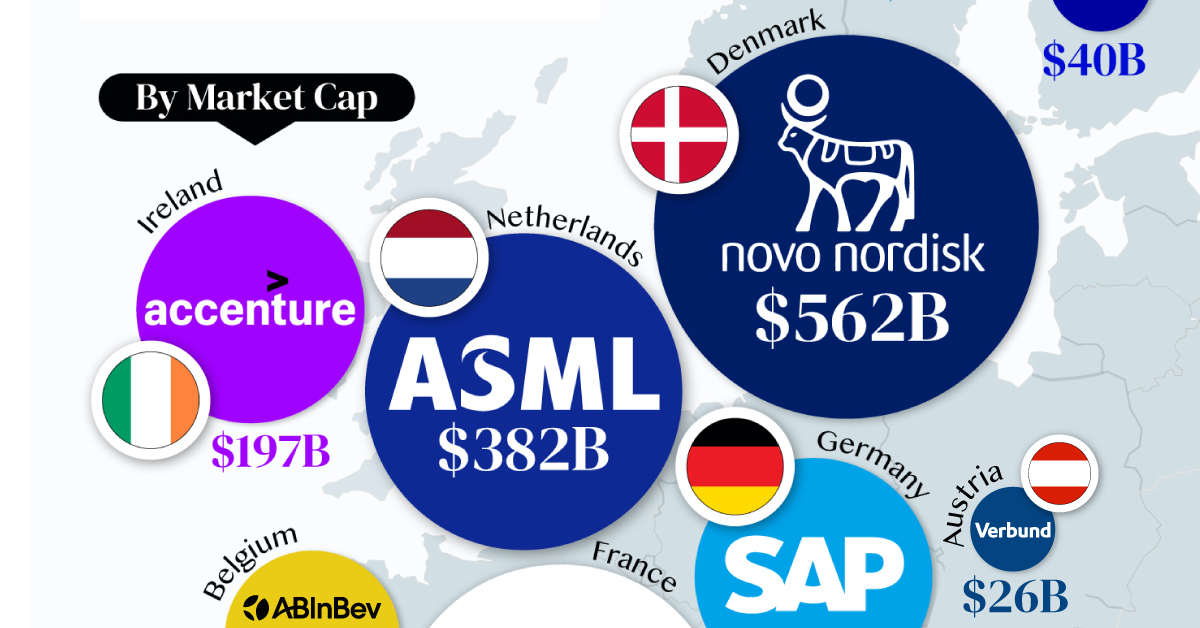
In this graphic, we mapped out the most valuable corporations in 11 major EU economies, based on their market capitalizations as of April 15th, 2024. All figures are in USD, and were sourced from Companiesmarketcap.com.
Novo Nordisk is currently worth more than $550 billion, making it Europe’s most valuable company by a wide margin. The pharmaceutical giant specializes in diabetes and weight-loss drugs. Demand for two of them, Ozempic and Wegovy, has surged due to their weight-loss capabilities, even causing nationwide shortages in the United States.
The following table includes an expanded list of the most valuable publicly-traded company in larger EU economies. Many of these were not included in the graphic due to space limitations.
| Country | Company | Sector | Market Cap |
|---|---|---|---|
| 🇩🇰 Denmark | 💊 Novo Nordisk | Pharmaceuticals | $562B |
| 🇫🇷 France | 👜 LVMH | Luxury Goods | $422B |
| 🇳🇱 Netherlands | 🔧 ASML | Semiconductor Equipment | $382B |
| 🇩🇪 Germany | 💼 SAP | Enterprise Software | $214B |
| 🇮🇪 Ireland | 🖥️ Accenture | IT Services | $197B |
| 🇪🇸 Spain | 👗 Inditex | Retail | $147B |
| 🇧🇪 Belgium | 🍻 Anheuser-Busch InBev | Beverages | $116B |
| 🇸🇪 Sweden | 🛠️ Atlas Copco | Industrial Equipment | $80B |
| 🇮🇹 Italy | 🏎️ Ferrari | Automotive | $76B |
| 🇫🇮 Finland | 🏦 Nordea Bank | Banking | $40B |
| 🇦🇹 Austria | 🔌 Verbund AG | Energy | $26B |
| 🇱🇺 Luxembourg | 🏗️ Tenaris | Oil & Gas Equipment | $22B |
| 🇨🇿 Czech Republic | 💡 CEZ Group | Energy | $20B |
| 🇵🇱 Poland | ⛽ PKN Orlen | Energy | $20B |
| 🇵🇹 Portugal | 🔌 EDP Group | Energy | $16B |
| 🇬🇷 Greece | 🏦 Eurobank | Banking | $7B |
| 🇭🇺 Hungary | ⛽ MOL Group | Energy | $7B |
| 🇭🇷 Croatia | 🏦 Zagrebacka Banka | Banking | $6B |
| 🇷🇴 Romania | ⛽ Romgaz | Energy | $4B |
| 🇸🇮 Slovenia | 💊 Krka | Pharmaceuticals | $4B |
Note: Figures are rounded and last updated on April 15th, 2024. Countries with top publicly-traded companies worth under $4 billion are excluded.
Luxury supergiant LVMH—which owns brands like Tiffany, Christian Dior, and TAG Heuer to name a few—is Europe’s second largest company by market cap, at $420 billion.
Rounding out the top three is ASML, which produces equipment crucial to chip manufacturers, worth $380 billion.
When looking at the region, there is a vast disparity between EU member states and their most valuable companies.
For example, as mentioned earlier, Denmark’s Novo Nordisk and France’s LVMH are worth between $400-550 billion each. Meanwhile, some countries don’t even have a single publicly-listed company that is worth over $1 billion.
In fact, only 12 EU countries (less than half of the union) are home to the top 100 most valuable companies within the bloc. An additional four countries are represented if you look at the list of the top 200 companies.

-

 Technology7 days ago
All of the Grants Given by the U.S. CHIPS Act
-

 Misc2 weeks ago
How Hard Is It to Get Into an Ivy League School?
-

 Debt2 weeks ago
How Debt-to-GDP Ratios Have Changed Since 2000
-

 Sports2 weeks ago
The Highest Earning Athletes in Seven Professional Sports
-

 Science2 weeks ago
Visualizing the Average Lifespans of Mammals
-

 Brands1 week ago
How Tech Logos Have Evolved Over Time
-

 Energy1 week ago
Ranked: The Top 10 EV Battery Manufacturers in 2023
-

 Demographics1 week ago
Countries With the Largest Happiness Gains Since 2010