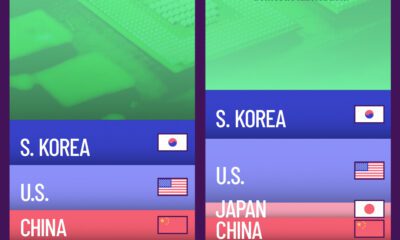
Advanced semiconductors drive technological innovation across various industries. Here, we visualize foundry capacity by country.


click for more →


Scan with your phone's camera or QR code app to view
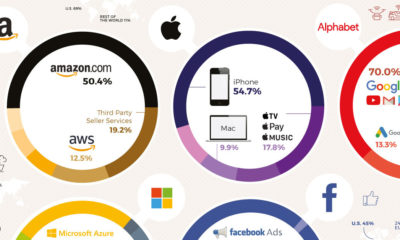

The big five tech companies generate almost $900 billion in revenues combined, more than the GDP of four of the G20 nations. Here's how they earn...
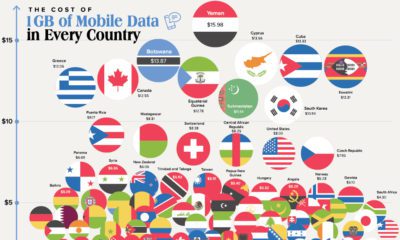

Globally, the cost of mobile data ranges between $0.09 per GB up to $27 per GB. Here's how it breaks down in 150+ countries.
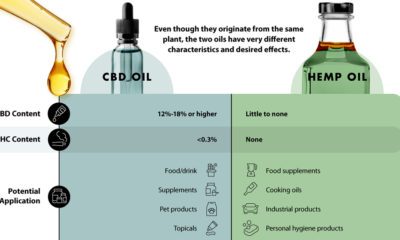

CBD Oil vs. Hemp Oil: What’s the Difference? For many consumers, cannabis plays a significant role in the treatment of medical conditions and managing general well-being....
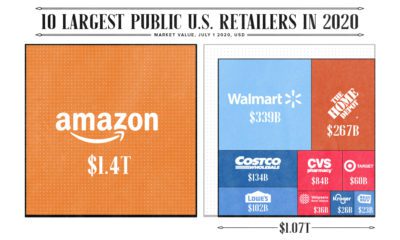

Amazon's valuation has grown by 2,830% over the last decade, and the tech giant is now worth more than the other 9 largest U.S. retailers, combined.
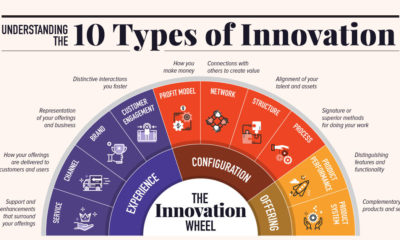

How do companies like Amazon and Apple consistently make game-changing products? Here are 10 types of innovation, and the tactics that lead to big breakthroughs.
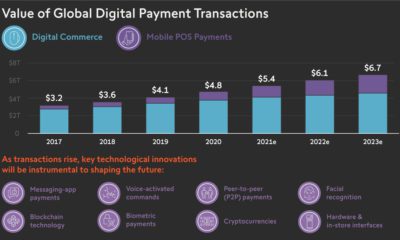

By 2023, digital transaction values could reach $6.7T globally—catalyzed by digital commerce and mobile payments. COVID-19 is only accelerating this trend.
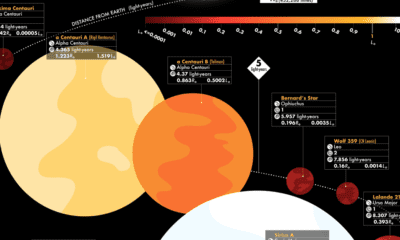

This graphic visualizes the 44 closest stars, revealing key facts such as distance from Earth, brightness, and whether potential planets are in orbit.
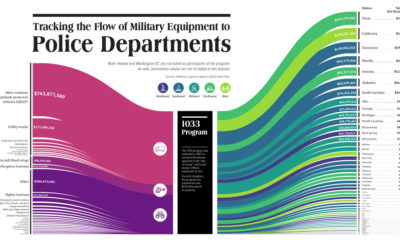

This visualization tracks the last decade of the 1033 Program, which provides free military equipment to police departments around the U.S.
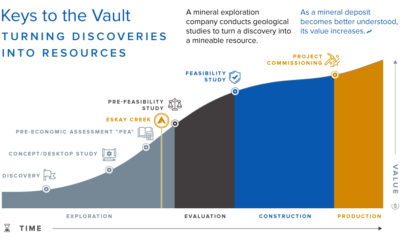

There are untold treasures in the Earth’s surface waiting for discovery. Skeena Resources is opening the vault in the Golden Triangle at Eskay Creek.
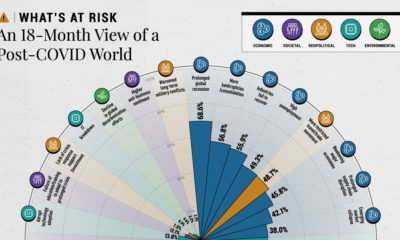

The WEF surveyed 347 risk analysts to uncover the most likely post-pandemic threats—and no area from the economy to the environment is untouched.
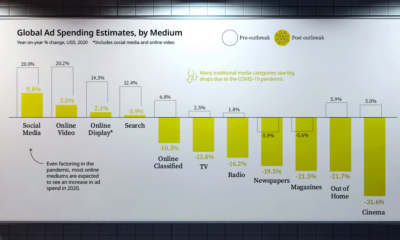

Global advertising spending is estimated to see $50 billion decline across various mediums and industries as a result of COVID-19.
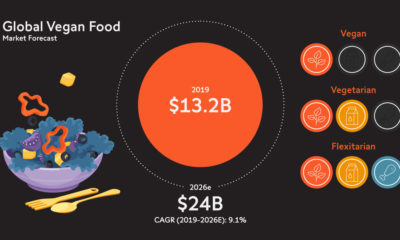

This graphic unearths the origins of the meatless revolution, while exploring how the $1.8 trillion meat market is responding to the threat of disruption.
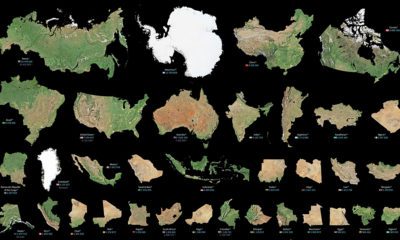

Maps can distort the size and shape of countries. This visualization puts the true size of land masses together from biggest to smallest.
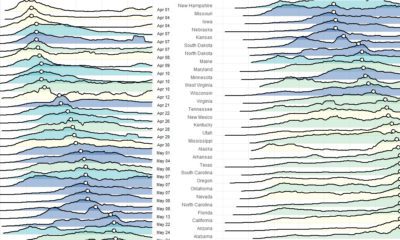

These charts and maps show the evolution of COVID-19's spread in the United States, by organizing data based on peak case and death dates.
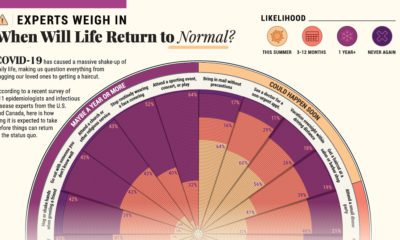

COVID-19 has caused a massive shake-up of our daily lives. Here, 511 epidemiologists offer their insights on when they might resume 20 common activities.
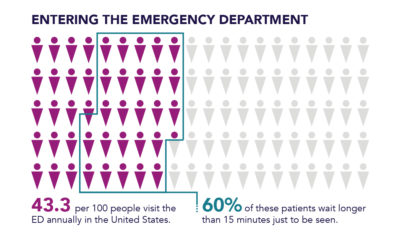

How Hospital Bottlenecks Cause A Healthcare Gridlock The healthcare industry is complex and interdependent. Much like a highway interchange, it relies on multiple players and processes...
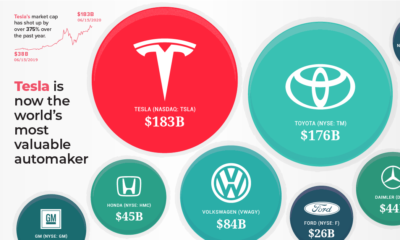

Thanks to a surging stock price, Tesla is now the world's most valuable automaker – surpassing industry giants Toyota and Volkswagen.


