Misc
The 44 Closest Stars and How They Compare to our Sun
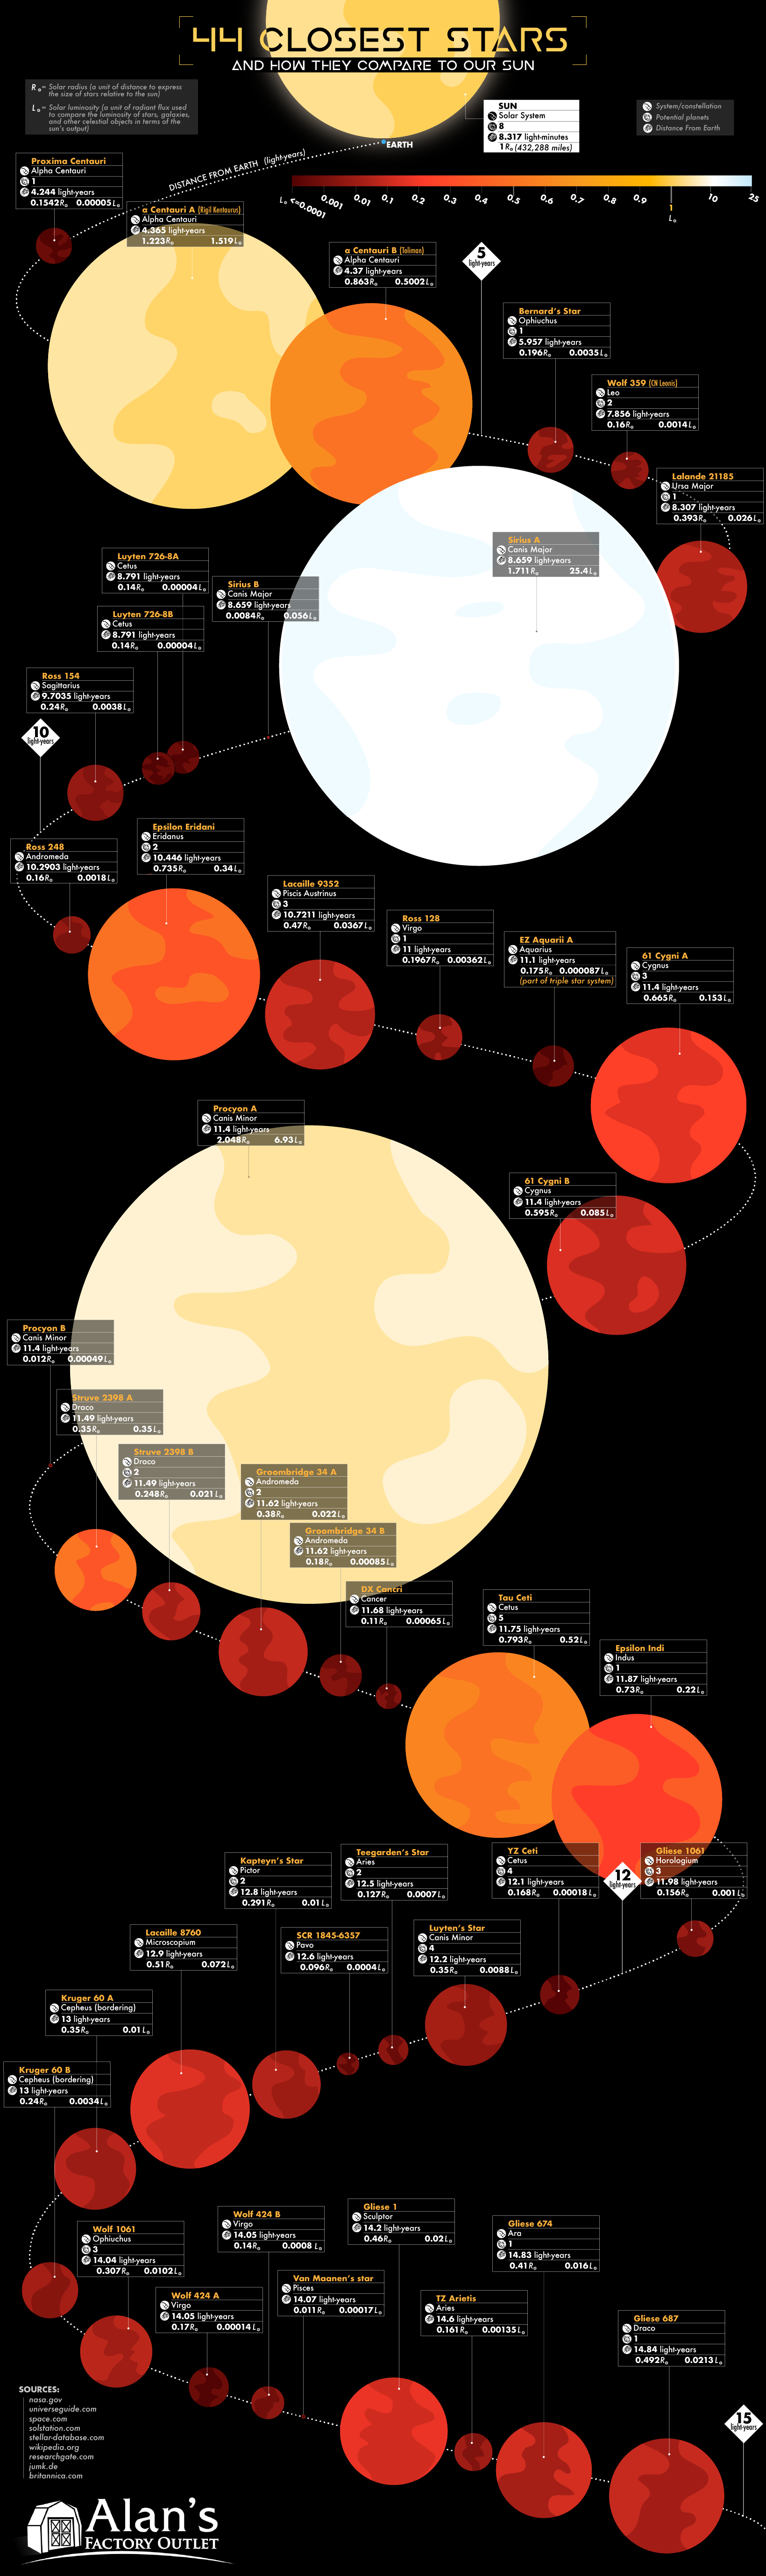
44 Closest Stars and How They Compare to our Sun
Humans have been fascinated by the stars in the night sky since the dawn of time.
We’ve been decoding the mysteries of celestial bodies for many centuries, but it is only in the last 200 years or so that we’ve been able to glean more detailed information on the lights that dot the night sky. Friedrich Bessel’s method of stellar parallax was a breakthrough in accurately measuring the positions of stars, and opened new doors in the effort to map our universe. Today, high-powered telescopes offer even more granular data on our cosmic neighborhood.
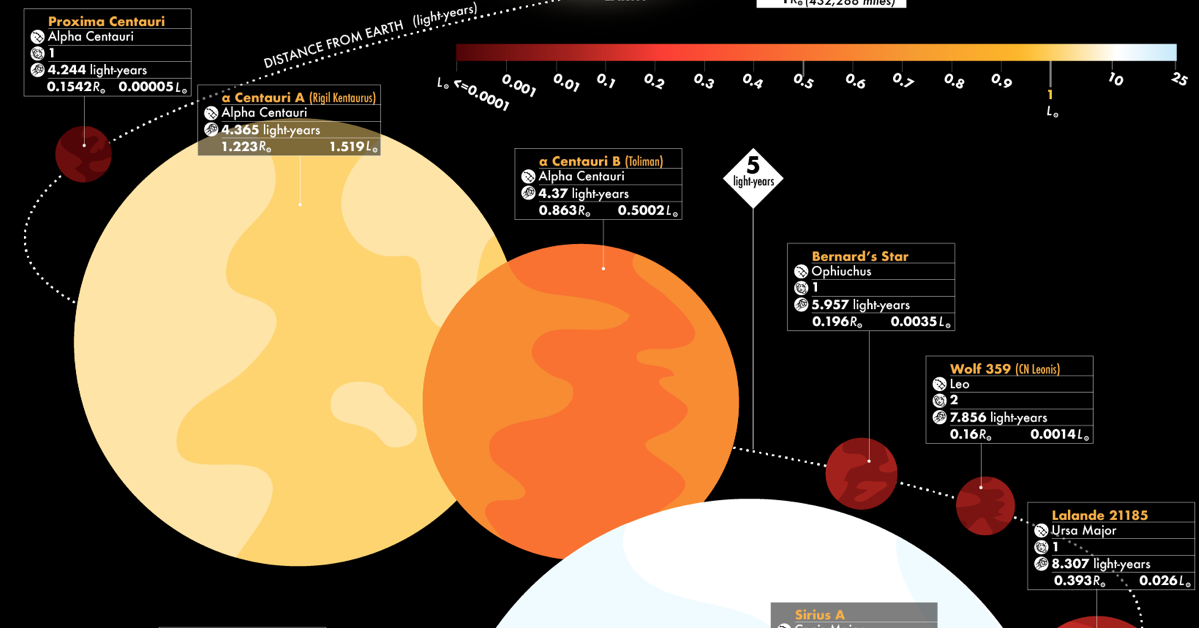
The infographic above, from Alan’s Factory Outlet, categorizes the 44 closest stars to Earth, examining the size, luminosity, constellations, systems, and potential planets of each star.
Our Nearest Stellar Neighbors
Our closest neighboring stars are all part of the same solar system: Alpha Centauri. This triple star system – consisting of Proxima Centauri, Alpha Centauri A, and Alpha Centauri B – attracts a lot of interest because it hosts planets, including one that may be similar to Earth.
The planet, Proxima Centauri b, is a lot closer to its star than Earth is to the Sun. However, because Proxima Centauri is a smaller and cooler red dwarf type star, the planet’s orbit is within the habitable zone. It’s thought that Proxima Centauri b receives approximately the same amount of solar energy as Earth does from our Sun.
Here’s a full list of the 44 of the closest stars to Earth:
| Star Name | Distance (light years) | MoE |
|---|---|---|
| Sun | 0.000016 | ±0.0011 |
| Proxima Centauri | 4.37 | ±0.0068 |
| α Centauri A | 4.37 | ±0.0068 |
| α Centauri B | 4.37 | ±0.0068 |
| Barnard's Star | 5.96 | ±0.0032 |
| Wolf 359 | 7.86 | ±0.031 |
| Lalande 21185 | 8.31 | ±0.014 |
| Sirius A | 8.66 | ±0.010 |
| Sirius B | 8.66 | ±0.010 |
| Luyten 726-8 A | 8.79 | ±0.012 |
| Luyten 726-8 B | 8.79 | ±0.012 |
| Ross 154 | 9.70 | ±0.0019 |
| Ross 248 | 10.29 | ±0.0041 |
| Epsilon Eridani | 10.45 | ±0.016 |
| Lacaille 9352 | 10.72 | ±0.0016 |
| Ross 128 | 11.01 | ±0.0026 |
| EZ Aquarii A | 11.11 | ±0.034 |
| 61 Cygni A | 11.40 | ±0.0012 |
| 61 Cygni B | 11.40 | ±0.0012 |
| Procyon A | 11.40 | ±0.032 |
| Procyon B | 11.40 | ±0.032 |
| Struve 2398 A | 11.49 | ±0.0012 |
| Struve 2398 B | 11.49 | ±0.0012 |
| Groombridge 34 A | 11.62 | ±0.0008 |
| Groombridge 34 B | 11.62 | ±0.0008 |
| DX Cancri | 11.68 | ±0.0056 |
| Tau Ceti | 11.75 | ±0.022 |
| Epsilon Indi | 11.87 | ±0.011 |
| Gliese 1061 | 11.98 | ±0.0029 |
| YZ Ceti | 12.11 | ±0.0035 |
| Luyten's Star | 12.20 | ±0.036 |
| Teegarden's Star | 12.50 | ±0.013 |
| SCR 1845-6357 | 13.05 | ±0.008 |
| Kapteyn's Star | 12.83 | ±0.0013 |
| Lacaille 8760 | 12.95 | ±0.0029 |
| Kruger 60 A | 13.07 | ±0.0052 |
| Kruger 60 B | 13.07 | ±0.0052 |
| Wolf 1061 | 14.05 | ±0.0038 |
| Wolf 424 A | 14.05 | ±0.26 |
| Van Maanen's star | 14.07 | ±0.0023 |
| Gliese 1 | 14.17 | ±0.0037 |
| TZ Arietis | 14.58 | ±0.0070 |
| Gliese 674 | 14.84 | ±0.0033 |
| Gliese 687 | 14.84 | ±0.0022 |
Even though we see many of these stars in the night sky, humans aren’t likely to see them in person any time soon. To put these vast distances into perspective, if the Voyager spacecraft were to travel to Proxima Centauri, it would take over 73,000 years to finally arrive.
The Brightest Stars in the Sky
The closest stars aren’t necessarily the ones most visible to us here on Earth. Here are the top 10 stars in terms of visual brightness from Earth:
| Rank | Proper name | Constellation | Visual magnitude (mV) | Distance (light years) |
|---|---|---|---|---|
| 1 | Sun | N/A | −26.74 | 0.000016 |
| 2 | Sirius | Canis Major | −1.46 | 8.6 |
| 3 | Canopus | Carina | −0.74 | 310.0 |
| 4 | Rigil Kentaurus & Toliman | Centaurus | −0.27 (0.01 + 1.33) | 4.4 |
| 5 | Arcturus | Boötes | −0.05 | 37.0 |
| 6 | Vega | Lyra | 0.03 (−0.02–0.07var) | 25.0 |
| 7 | Capella | Auriga | 0.08 (0.03–0.16var) | 43.0 |
| 8 | Rigel | Orion | 0.13 (0.05–0.18var) | 860.0 |
| 9 | Procyon | Canis Minor | 0.34 | 11.0 |
| 10 | Achernar | Eridanus | 0.46 (0.40–0.46var) | 139.0 |
Excluding our Sun, the brightest star visible from Earth is Sirius, or the Dog Star. Sirius, which is about 25 times more luminous than the sun, visually punctuates the constellation Canis Major.
Filling in the Gaps
The next step in learning more about our surroundings in the cosmos will be seeing which of the stars listed above have planets orbiting them. So far, the 44 stars in the infographic have over 40 planets scattered among them, though new discoveries are made all the time.
With each new mission and discovery, we learn a little bit more about our pocket of the universe.
Misc
How Hard Is It to Get Into an Ivy League School?
We detail the admission rates and average annual cost for Ivy League schools, as well as the median SAT scores required to be accepted.


How Hard Is It to Get Into an Ivy League School?
This was originally posted on our Voronoi app. Download the app for free on iOS or Android and discover incredible data-driven charts from a variety of trusted sources.
Ivy League institutions are renowned worldwide for their academic excellence and long-standing traditions. But how hard is it to get into one of the top universities in the U.S.?
In this graphic, we detail the admission rates and average annual cost for Ivy League schools, as well as the median SAT scores required to be accepted. The data comes from the National Center for Education Statistics and was compiled by 24/7 Wall St.
Note that “average annual cost” represents the net price a student pays after subtracting the average value of grants and/or scholarships received.
Harvard is the Most Selective
The SAT is a standardized test commonly used for college admissions in the United States. It’s taken by high school juniors and seniors to assess their readiness for college-level academic work.
When comparing SAT scores, Harvard and Dartmouth are among the most challenging universities to gain admission to. The median SAT scores for their students are 760 for reading and writing and 790 for math. Still, Harvard has half the admission rate (3.2%) compared to Dartmouth (6.4%).
| School | Admission rate (%) | SAT Score: Reading & Writing | SAT Score: Math | Avg Annual Cost* |
|---|---|---|---|---|
| Harvard University | 3.2 | 760 | 790 | $13,259 |
| Columbia University | 3.9 | 750 | 780 | $12,836 |
| Yale University | 4.6 | 760 | 780 | $16,341 |
| Brown University | 5.1 | 760 | 780 | $26,308 |
| Princeton University | 5.7 | 760 | 780 | $11,080 |
| Dartmouth College | 6.4 | 760 | 790 | $33,023 |
| University of Pennsylvania | 6.5 | 750 | 790 | $14,851 |
| Cornell University | 7.5 | 750 | 780 | $29,011 |
*Costs after receiving federal financial aid.
Additionally, Dartmouth has the highest average annual cost at $33,000. Princeton has the lowest at $11,100.
While student debt has surged in the United States in recent years, hitting $1.73 trillion in 2023, the worth of obtaining a degree from any of the schools listed surpasses mere academics. This is evidenced by the substantial incomes earned by former students.
Harvard grads, for example, have the highest average starting salary in the country, at $91,700.

-

 Maps2 weeks ago
Mapped: Average Wages Across Europe
-

 Money1 week ago
Which States Have the Highest Minimum Wage in America?
-

 Real Estate1 week ago
Ranked: The Most Valuable Housing Markets in America
-

 Markets1 week ago
Charted: Big Four Market Share by S&P 500 Audits
-

 AI1 week ago
The Stock Performance of U.S. Chipmakers So Far in 2024
-

 Automotive2 weeks ago
Almost Every EV Stock is Down After Q1 2024
-

 Money2 weeks ago
Where Does One U.S. Tax Dollar Go?
-

 Green2 weeks ago
Ranked: Top Countries by Total Forest Loss Since 2001