Markets
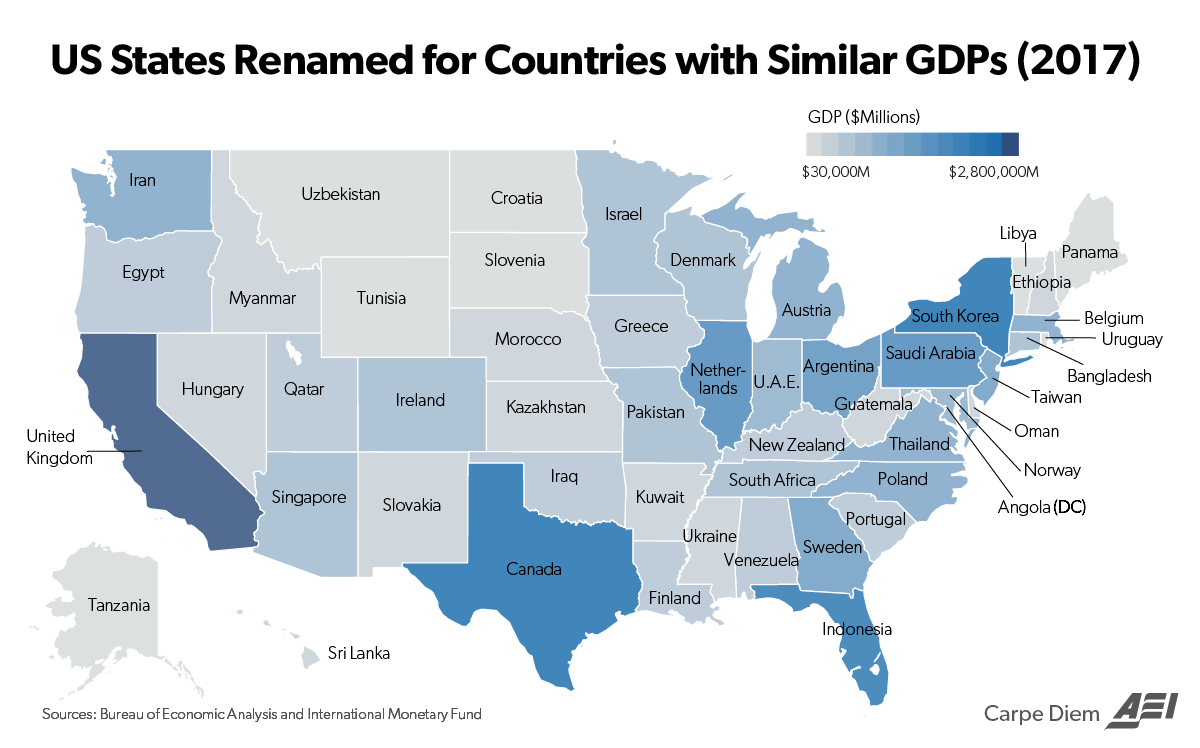
This Map Compares the Size of State Economies with Entire Countries
This Map Compares the Size of State Economies with Entire Countries
The United States is the world’s largest economy, but sometimes it’s easy to forget just how massive a $19 trillion economy actually is.
The only comparable economy in size would be China, but unfortunately the incredible scope of China’s economic boom is something that is also difficult for foreigners to wrap their heads around. We’ve tried to do this in the past by showing you the massive cities that no one knows about, ambitious megaprojects that are underway in the region, and the country’s staggering demand for commodities.
But still, comparing the U.S. to China can be overwhelming – and that’s why it can be more effective to show the U.S. economy as the sum of its parts.
States as Countries
Today’s infographic comes to us from the Carpe Diem blog done by Mark Perry at the American Enterprise Institute.
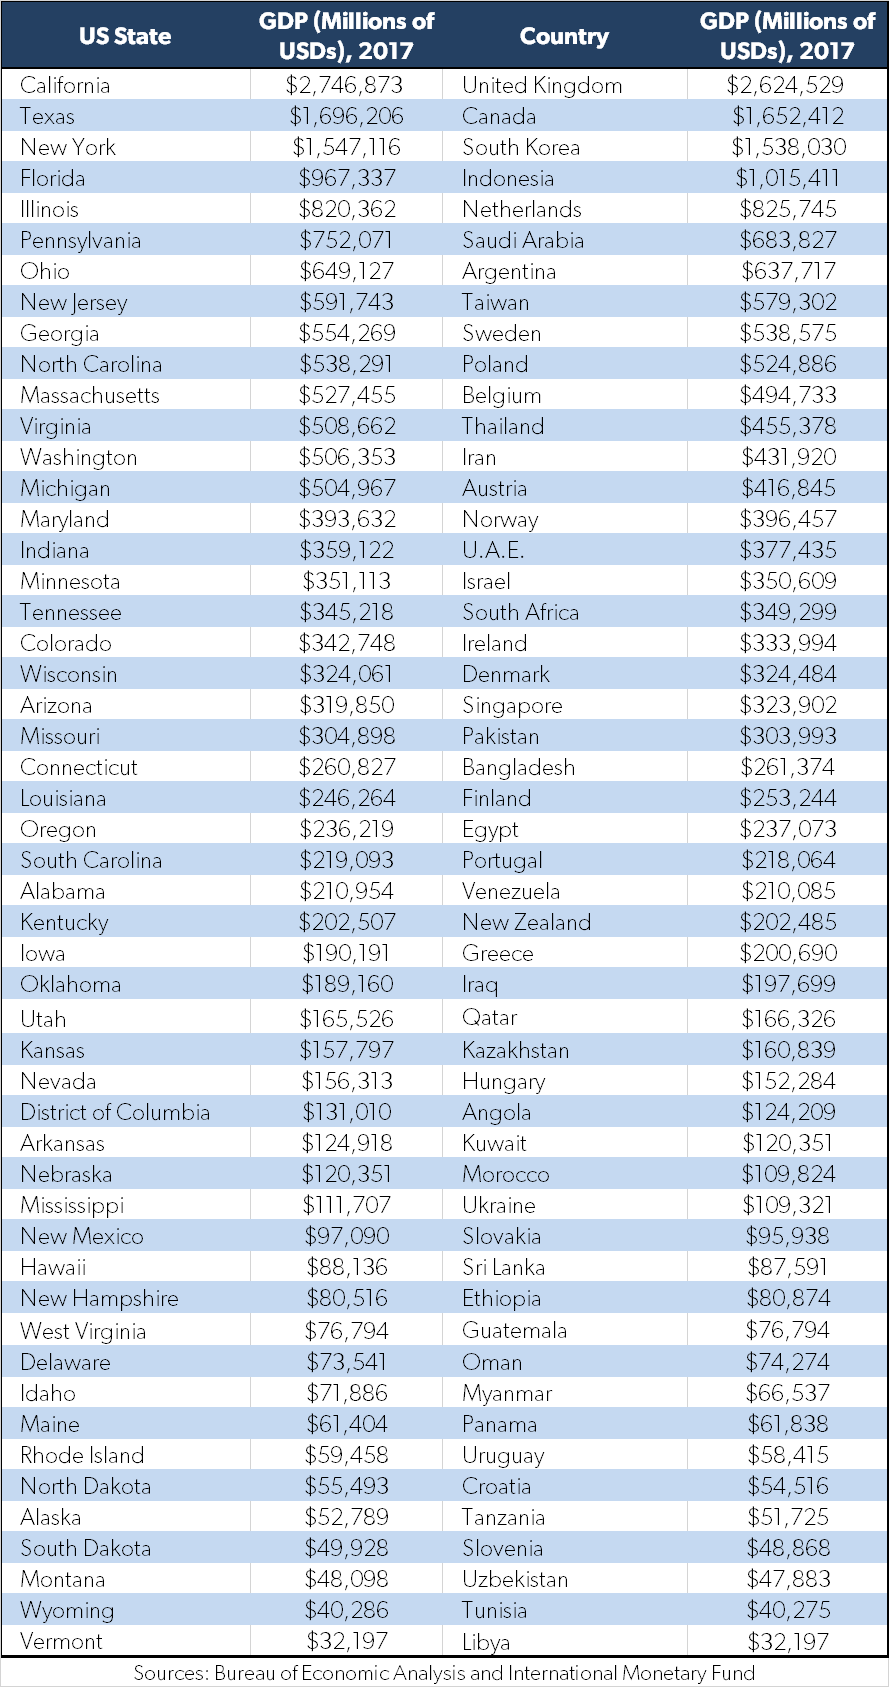
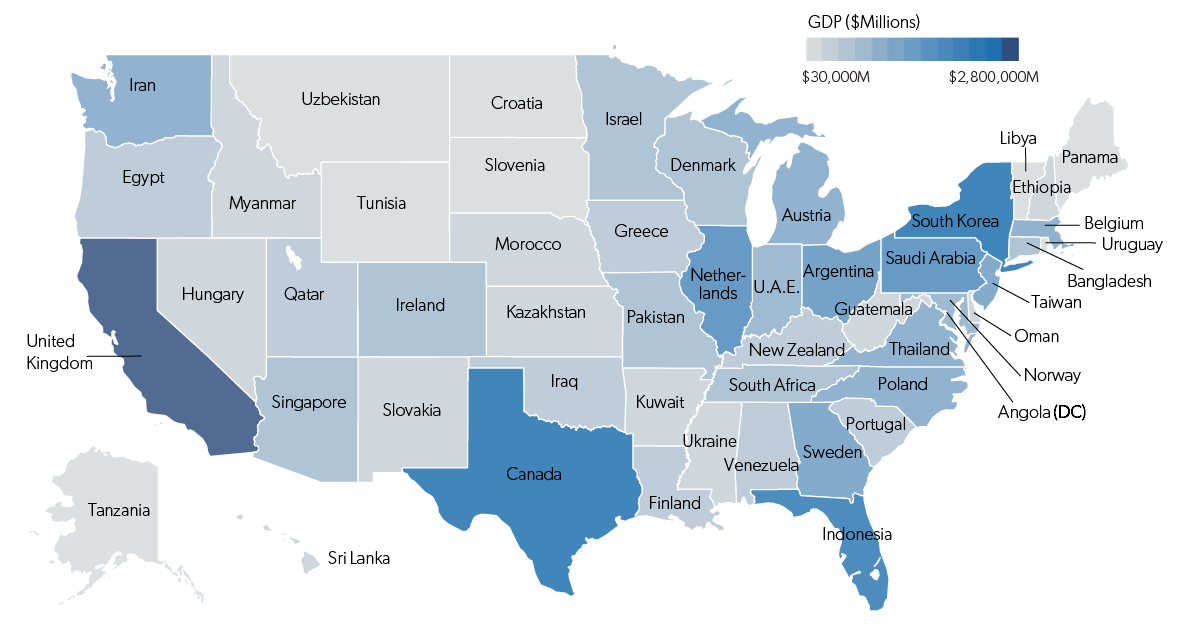
It matches the size of U.S. state economies, based on nominal GDP numbers, with comparable countries around the world. For example, the state of Texas ($1.7 trillion) is roughly the equivalent of Canada ($1.65 trillion), while Maine ($61.4 billion) is closer to Panama ($61.8 billion) in terms of economic output.
Here’s the full table – courtesy of Carpe Diem – on how each state breaks down:
Sum of the Parts
By looking at the United States in this unique way, we really get a better sense of the scale of the country’s economy as a whole.
Add together just the states of California, Texas, and New York, and you’ve got an economy the size of the United Kingdom, Canada, and South Korea put together. And with each additional state, you’re adding significant economies like Indonesia, Netherlands, Saudi Arabia, or Singapore to that mix.
Impressively, even the more sparsely populated states have country-sized economies. Montana compares to Uzbekistan, North Dakota is similar to Croatia, and so on.
If you’re interested in seeing other ways to visualize America’s economy, see a previous post using some other Carpe Diem maps here.


Markets
Visualizing Global Inflation Forecasts (2024-2026)
Here are IMF forecasts for global inflation rates up to 2026, highlighting a slow descent of price pressures amid resilient global growth.


Visualizing Global Inflation Forecasts (2024-2026)
Global inflation rates are gradually descending, but progress has been slow.
Today, the big question is if inflation will decline far enough to trigger easing monetary policy. So far, the Federal Reserve has held rates for nine months amid stronger than expected core inflation, which excludes volatile energy and food prices.
Yet looking further ahead, inflation forecasts from the International Monetary Fund (IMF) suggest that inflation will decline as price pressures ease, but the path of disinflation is not without its unknown risks.
This graphic shows global inflation forecasts, based on data from the April 2024 IMF World Economic Outlook.
Get the Key Insights of the IMF’s World Economic Outlook
Want a visual breakdown of the insights from the IMF’s 2024 World Economic Outlook report?
This visual is part of a special dispatch of the key takeaways exclusively for VC+ members.
Get the full dispatch of charts by signing up to VC+.
The IMF’s Inflation Outlook
Below, we show the IMF’s latest projections for global inflation rates through to 2026:
| Year | Global Inflation Rate (%) | Advanced Economies Inflation Rate (%) | Emerging Market and Developing Economies Inflation Rate (%) |
|---|---|---|---|
| 2019 | 3.5 | 1.4 | 5.1 |
| 2020 | 3.2 | 0.7 | 5.2 |
| 2021 | 4.7 | 3.1 | 5.9 |
| 2022 | 8.7 | 7.3 | 9.8 |
| 2023 | 6.8 | 4.6 | 8.3 |
| 2024 | 5.9 | 2.6 | 8.3 |
| 2025 | 4.5 | 2.0 | 6.2 |
| 2026 | 3.7 | 2.0 | 4.9 |
After hitting a peak of 8.7% in 2022, global inflation is projected to fall to 5.9% in 2024, reflecting promising inflation trends amid resilient global growth.
While inflation has largely declined due to falling energy and goods prices, persistently high services inflation poses challenges to mitigating price pressures. In addition, the IMF highlights the potential risk of an escalating conflict in the Middle East, which could lead to energy price shocks and higher shipping costs.
These developments could negatively affect inflation scenarios and prompt central banks to adopt tighter monetary policies. Overall, by 2026, global inflation is anticipated to decline to 3.7%—still notably above the 2% target set by several major economies.
Adding to this, we can see divergences in the path of inflation between advanced and emerging economies. While affluent nations are forecast to see inflation edge closer to the 2% target by 2026, emerging economies are projected to have inflation rates reach 4.9%—falling closer to their pre-pandemic averages.
Get the Full Analysis of the IMF’s Outlook on VC+
This visual is part of an exclusive special dispatch for VC+ members which breaks down the key takeaways from the IMF’s 2024 World Economic Outlook.
For the full set of charts and analysis, sign up for VC+.

-

 Culture6 days ago
The World’s Top Media Franchises by All-Time Revenue
-

 Science2 weeks ago
Visualizing the Average Lifespans of Mammals
-

 Brands2 weeks ago
How Tech Logos Have Evolved Over Time
-

 Energy2 weeks ago
Ranked: The Top 10 EV Battery Manufacturers in 2023
-

 Countries2 weeks ago
Countries With the Largest Happiness Gains Since 2010
-

 Economy2 weeks ago
VC+: Get Our Key Takeaways From the IMF’s World Economic Outlook
-

 Demographics1 week ago
The Countries That Have Become Sadder Since 2010
-

 Money1 week ago
Charted: Who Has Savings in This Economy?