Technology
Predicting the Future of Media and Entertainment
View a high resolution version of this graphic
Visualizing the Future of Media and Entertainment
View the high resolution version of today’s graphic by clicking here.
Over your lifetime, the consumption of media and entertainment has already changed drastically.
For Boomers and Gen Xers, the shift has been earth-shattering. Both generations will remember a time before mainstream computing when TV was dominated by the Big Three TV networks (NBC, ABC, and CBS), and newspapers and magazines were the main way to stay in touch with what was happening.
Even millennials have seen fundamental shifts in consumption of media. After all, they experienced the rise of social media, online news, streaming, and digital video firsthand. Many of them will remember their college getting access to Facebook for the first time, the death of Napster, and the funny sounds their 28.8k modem made as it struggled to successfully download a single image file.
The modern landscape of media is very different than it was back then – and the coming years will see even more prolific changes.
The Future of Media and Entertainment
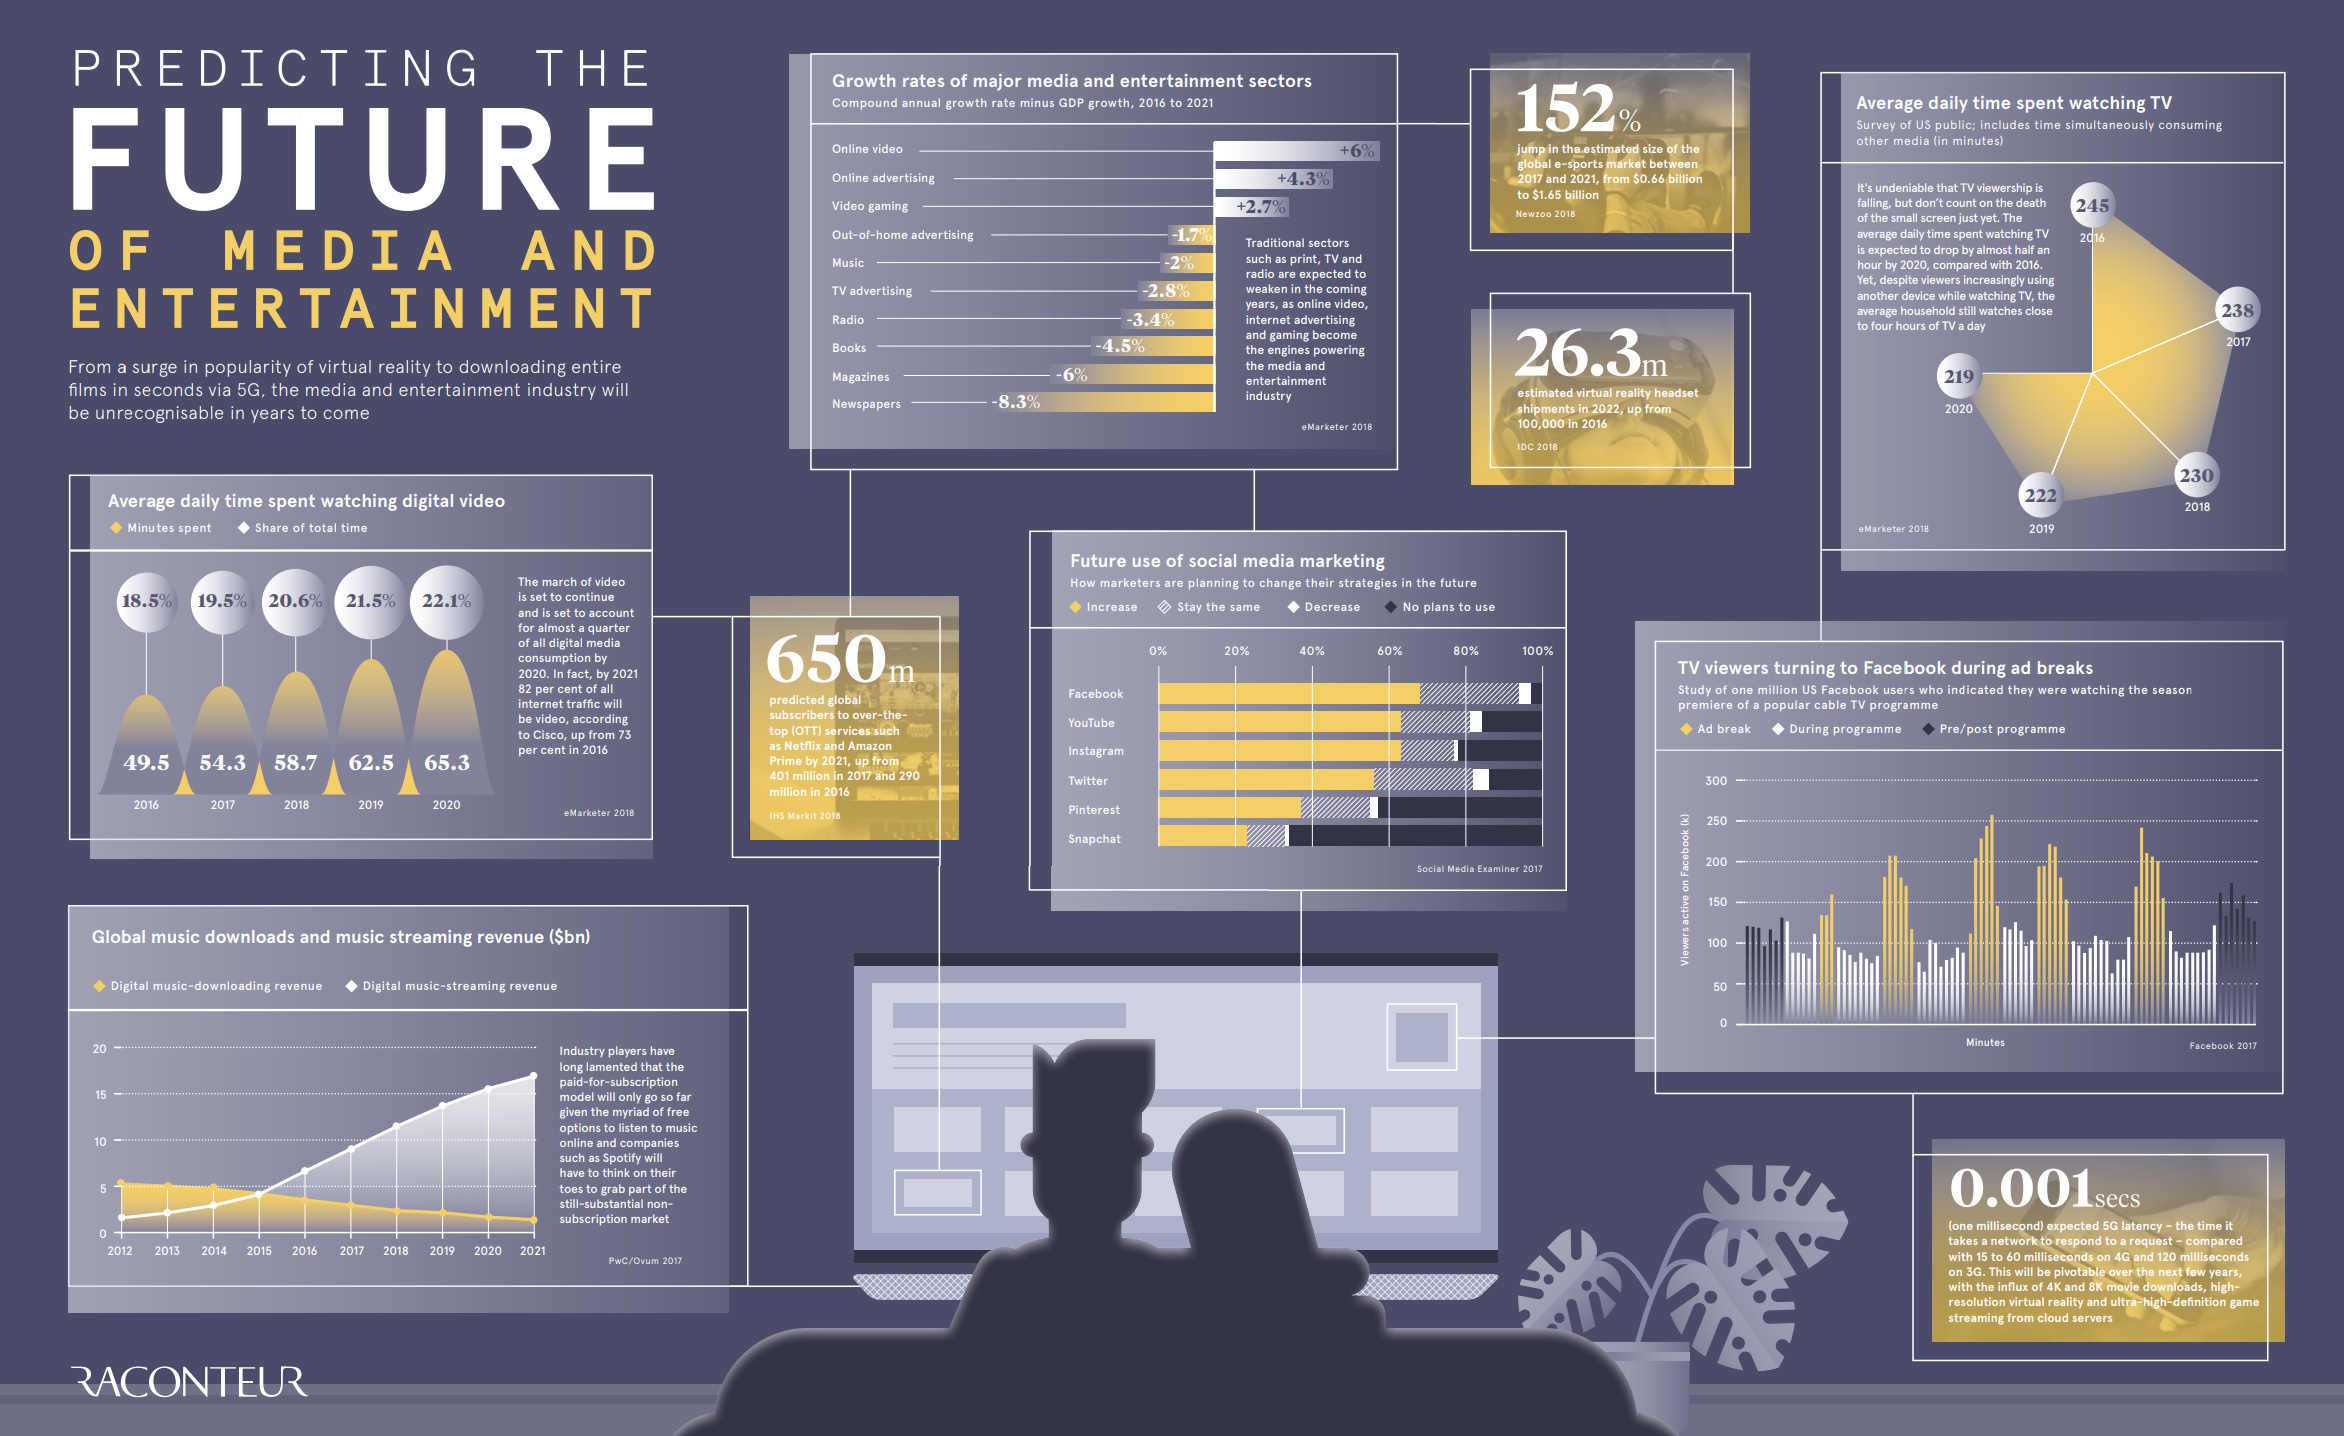
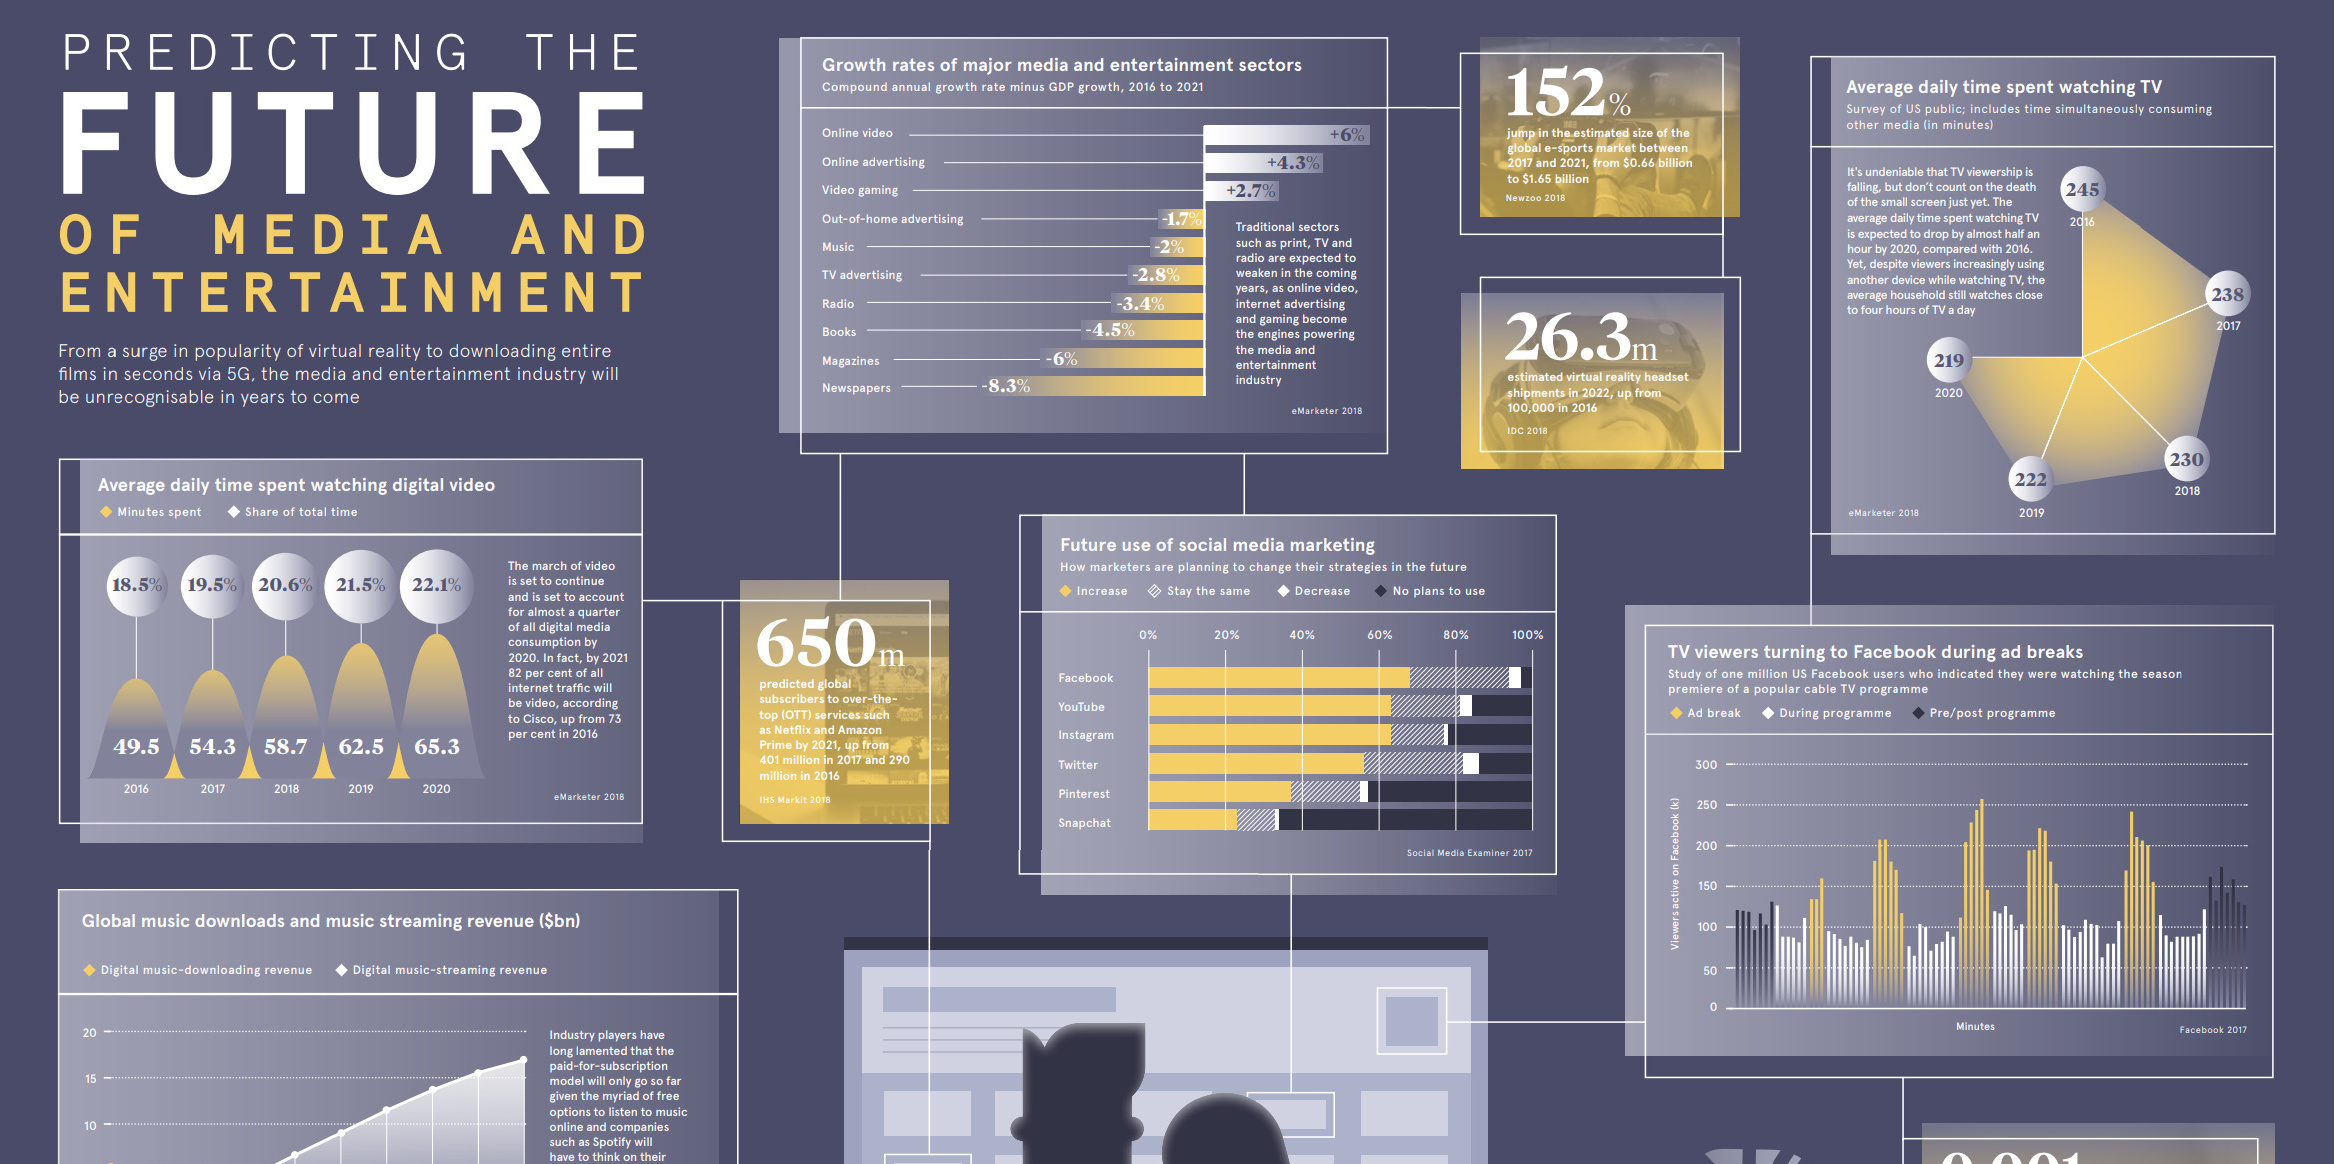
Today’s infographic comes to us from Raconteur, and it showcases multiple sets of data that help to illustrate the direction that media is heading. This includes the growth rates of various media and entertainment sectors, TV viewing trends, and social media use.
Here are some of the key trends that we found to be compelling:
Annualized Media Sector Growth (Minus GDP Growth) from 2016-2021
| Media sector | Annual Growth (minus GDP growth) |
|---|---|
| Online Video | 6.0% |
| Online Advertising | 4.3% |
| Video Gaming | 2.7% |
| Out-of home Ads | -1.7% |
| Music | -2.0% |
| TV Advertising | -2.8% |
| Radio | -3.4% |
| Books | -4.5% |
| Magazines | -6.0% |
| Newspapers | -8.3% |
Online video (6.0%), online ads (4.3%), and video gaming (2.7%) are the only sectors growing at a rate faster than GDP growth.
But while digital video use is growing, it’s not going to takeover TV anytime soon:
Daily Minutes Watching TV vs. Digital Video
| Year | TV (Minutes watched) | Digital Video (Minutes Watched) |
|---|---|---|
| 2016 | 245 | 49.5 |
| 2017 | 238 | 54.3 |
| 2018 | 230 | 58.7 |
| 2019 | 222 | 62.5 |
| 2020 | 219 | 65.3 |
Lastly, here are some figures on the future of media and entertainment that are particularly interesting:
- By 2021, Cisco says that 82% of all internet traffic will stem from digital video
- There will be 26.3 million VR headsets shipped in 2022, up from 100,000 in 2016
- The eSports market will jump 152% in size by 2021
- By 2021, there will be 650 million subscribers to services like Amazon Prime or Netflix
- 5G latency is expected to be 0.001 seconds, which is 15-60x faster than 4G
It’s fair to say that in another decade, media and entertainment will be much less recognizable than what it looks like today.


Technology
Countries With the Highest Rates of Crypto Ownership
While the U.S. is a major market for cryptocurrencies, two countries surpass it in terms of their rates of crypto ownership.


Countries With the Highest Rates of Crypto Ownership
This was originally posted on our Voronoi app. Download the app for free on iOS or Android and discover incredible data-driven charts from a variety of trusted sources.
This graphic ranks the top 10 countries by their rate of cryptocurrency ownership, which is the percentage of the population that owns crypto. These figures come from crypto payment gateway, Triple-A, and are as of 2023.
Data and Highlights
The table below lists the rates of crypto ownership in the top 10 countries, as well as the number of people this amounts to.
| Country | % of Population Who Own Crypto | # of Crypto Owners |
|---|---|---|
| 🇦🇪 United Arab Emirates | 30.4 | 3M |
| 🇻🇳 Vietnam | 21.2 | 21M |
| 🇺🇸 U.S. | 15.6 | 53M |
| 🇮🇷 Iran | 13.5 | 12M |
| 🇵🇭 Philippines | 13.4 | 16M |
| 🇧🇷 Brazil | 12 | 26M |
| 🇸🇦 Saudi Arabia | 11.4 | 4M |
| 🇸🇬 Singapore | 11.1 | 665K |
| 🇺🇦 Ukraine | 10.6 | 4M |
| 🇻🇪 Venezuela | 10.3 | 3M |
Note that if we were to rank countries based on their actual number of crypto owners, India would rank first at 93 million people, China would rank second at 59 million people, and the U.S. would rank third at 52 million people.
The UAE Takes the Top Spot
The United Arab Emirates (UAE) boasts the highest rates of crypto ownership globally. The country’s government is considered to be very crypto friendly, as described in Henley & Partners’ Crypto Wealth Report 2023:
In the UAE, the Financial Services Regulatory Authority (FSRA-ADGM) was the first to provide rules and regulations regarding cryptocurrency purchasing and selling. The Emirates are generally very open to new technologies and have proposed zero taxes for crypto owners and businesses.
Vietnam leads Southeast Asia
According to the Crypto Council for Innovation, cryptocurrency holdings in Vietnam are also untaxed, making them an attractive asset.
Another reason for Vietnam’s high rates of ownership could be its large unbanked population (people without access to financial services). Cryptocurrencies may provide an alternative means of accessing these services without relying on traditional banks.
Learn More About Crypto From Visual Capitalist
If you enjoyed this post, be sure to check out The World’s Largest Corporate Holders of Bitcoin, which ranks the top 12 publicly traded companies by their Bitcoin holdings.

-

 Markets5 days ago
Mapped: The Most Valuable Company in Each Southeast Asian Country
-

 Markets2 weeks ago
The Top Private Equity Firms by Country
-

 Jobs2 weeks ago
The Best U.S. Companies to Work for According to LinkedIn
-

 Economy2 weeks ago
Ranked: The Top 20 Countries in Debt to China
-

 Politics1 week ago
Charted: Trust in Government Institutions by G7 Countries
-

 Energy1 week ago
Mapped: The Age of Energy Projects in Interconnection Queues, by State
-

 Mining1 week ago
Visualizing Global Gold Production in 2023
-

 Markets1 week ago
Visualized: Interest Rate Forecasts for Advanced Economies