Misc
The Advertising Revolution: How Native Ads Have Changed the Game
The Advertising Revolution
Sponsored by: Market One Media Group
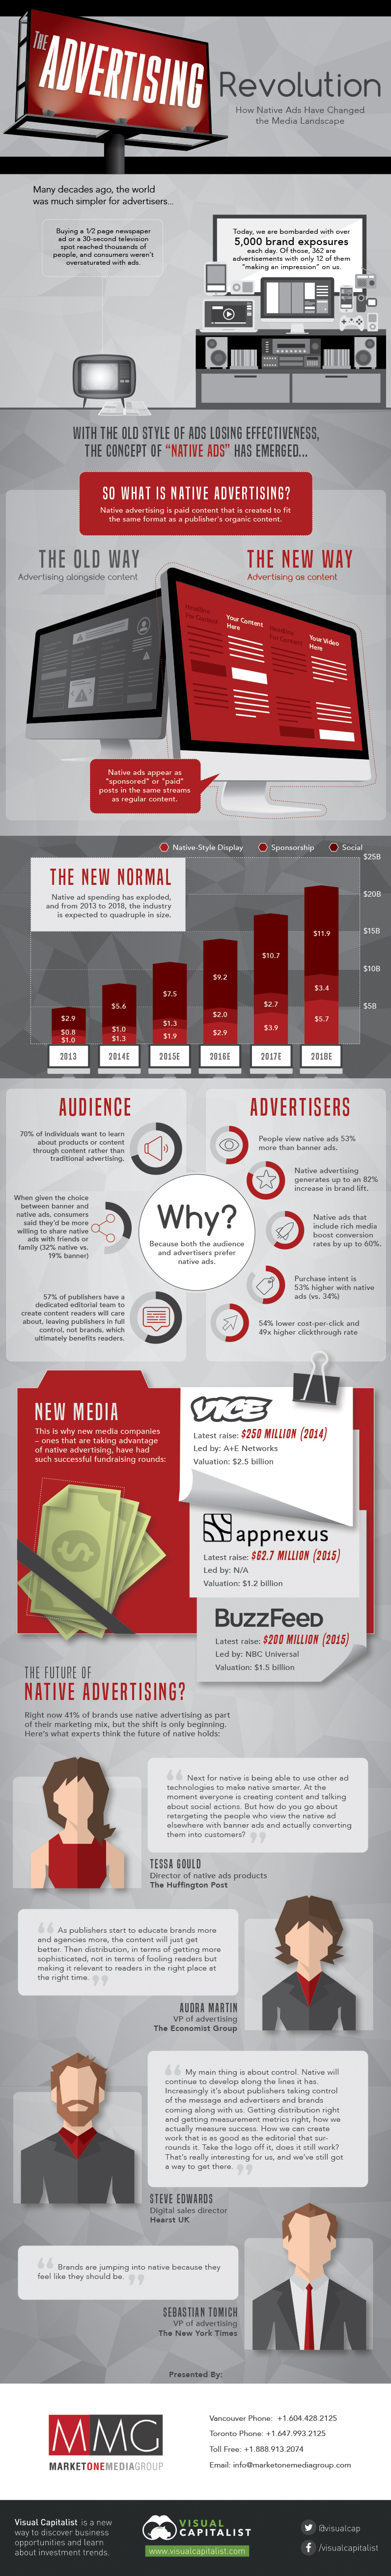
Many decades ago, the world was much simpler for advertisers.
Buying a ½ page newspaper ad or a 30-second television spot reached thousands of people, and consumers weren’t oversaturated with ads.
Today, we are bombarded with over 5,000 brand exposures each day. Of those, 362 are advertisements with only 12 of them “making an impression” on us.
Here’s a breakdown of average exposure per day:
- Average number of advertisement and brand exposures per day per person: 5,000+
- Average number of “ads only” exposures per day: 362
- Average number of “ads only” noted per day: 153
- Average number of “ads only” that we have some awareness of per day: 86
- Average number of “ads only” that made an impression (engagement): 12
With this oversaturation of the traditional ad market, the concept of “native ads” has emerged.
Native Ads
Native advertising is paid content that is created to fit the same format as a publisher’s organic content. In other words, it shows up to regular viewers as “sponsored” or “paid” posts in the same streams as regular content.
Native ad spending has exploded, and from 2013 to 2018, the industry is expected to quadruple in size.
There are compelling statistics for both the audience and advertisers on native ads:
Audience:
- 70% of individuals want to learn about products or content through content rather than traditional advertising.
- 32% of consumers said, when given a choice, that they would rather share a native ad with friends and family vs 19% for banner ads.
- 57% of publishers have a dedicated editorial team to create content readers will care about, leaving publishers in full control, not brands, which ultimately benefits readers.
Advertisers:
- People view native ads 53% more than banner ads.
- Native advertising generates up to an 82% increase in brand lift.
- Native ads that include rich media boost conversion rates by up to 60%.
- Purchase intent is 53% higher with native ads (vs. 34%)
- 49x higher clickthrough rate, 54% lower cost-per-click
New Media
Native ads are also being used by many of the “new media” and adtech companies that have had very successful fundraising rounds:
Vice
Latest raise: $250 million (2014)
Led by: A+E Networks
Valuation: $2.5 billion
AppNexus
Latest raise: $62.7 million (2015)
Valuation: $1.2 billion
Vox
Latest raise: $200 million (2015)
Led by: NBC Universal
Valuation: $850 million
Buzzfeed
Latest raise: $200 million (2015)
Led by: NBC Universal
Valuation: $1.5 billion
The Future of Native Advertising?
Right now 41% of brands use native advertising as part of their marketing mix, but the shift is only beginning. Here’s what experts think the future of native holds:
Tessa Gould, Director of Native Ads Products, The Huffington Post
“Next for native is being able to use other ad technologies to make native smarter. At the moment everyone is creating content and talking about social actions. But how do you go about retargeting the people who view the native ad elsewhere with banner ads and actually converting them into customers?”
Audra Martin, VP of Advertising, The Economist Group
“As publishers start to educate brands more and agencies more, the content will just get better. Then distribution, in terms of getting more sophisticated, not in terms of fooling readers but making it relevant to readers in the right place at the right time.”
Steve Edwards, Digital Sales Director, Hearst UK
“My main thing is about control. Native will continue to develop along the lines it has. Increasingly it’s about publishers taking control of the message and advertisers and brands coming along with us. Getting distribution right and getting measurement metrics right, how we actually measure success. How we can create work that is as good as the editorial that surrounds it. Take the logo off it, does it still work? That’s really interesting for us, and we’ve still got a way to get there.”
Sebastian Tomich, VP of Advertising, The New York Times
“Brands are jumping into native because they feel like they should be.”


Politics
Charted: Trust in Government Institutions by G7 Countries
How much do you trust the government and its various institutions? We look at data for G7 countries for the time period of 2006-2023.


Trust in Government Institutions by G7 Countries
This was originally posted on our Voronoi app. Download the app for free on iOS or Android and discover incredible data-driven charts from a variety of trusted sources.
How much do you trust the government, and its various institutions?
It’s likely that your level of confidence probably depends on a wide range of factors, such as perceived competency, historical context, economic performance, accountability, social cohesion, and transparency.
And for these same reasons, trust levels in government institutions also change all the time, even in the world’s most developed countries: the G7.
Confidence in Government by G7 Countries (2006-2023)
This chart looks at the changes in trust in government institutions between the years 2006 and 2023, based on data from a multi-country Gallup poll.
Specifically, this dataset aggregates confidence in multiple national institutions, including the military, the judicial system, the national government, and the integrity of the electoral system.
| Country | Confidence (2006) | Confidence (2023) | Change (p.p.) |
|---|---|---|---|
| Canada | 57% | 64% | +7 |
| Britain | 63% | 63% | +0 |
| Germany | 55% | 61% | +6 |
| France | 54% | 60% | +6 |
| Japan | 48% | 59% | +11 |
| Italy | 41% | 54% | +13 |
| United States | 63% | 50% | -13 |
What’s interesting here is that in the G7, a group of the world’s most developed economies, there is only one country bucking the general trend: the United States.
Across most G7 countries, confidence in institutions has either improved or stayed the same between 2006 and 2023. The largest percentage point (p.p.) increases occur in Italy and Japan, which saw +13 p.p. and +11 p.p. increases in trust over the time period.
In the U.S., however, confidence in government institutions has fallen by 13 p.p. over the years. What happened?
Key Figures on U.S. Trust in Institutions
In 2006, the U.S. was tied with the UK as having the highest confidence in government institutions, at 63%.
But here’s where the scores stand in 2023, across various institutions:
| 🇺🇸 Institutions | Confidence (2023) |
|---|---|
| Military | 81% |
| Judiciary | 42% |
| National Government | 30% |
| Elections | 44% |
| Overall | 49% |
Based on this data, it’s clear that the U.S. lags behind in three key indicators: confidence in the national government, confidence in the justice system, and confidence in fair elections. It ranked in last place for each indicator in the G7.
One other data point that stands out: despite leading the world in military spending, the U.S. is only the third most confident in its military in the G7. It lags behind France (86%) and the United Kingdom (83%).

-

 Wealth6 days ago
Charted: Which City Has the Most Billionaires in 2024?
-

 Mining2 weeks ago
Gold vs. S&P 500: Which Has Grown More Over Five Years?
-

 Uranium2 weeks ago
The World’s Biggest Nuclear Energy Producers
-

 Education2 weeks ago
How Hard Is It to Get Into an Ivy League School?
-

 Debt2 weeks ago
How Debt-to-GDP Ratios Have Changed Since 2000
-

 Sports2 weeks ago
The Highest Earning Athletes in Seven Professional Sports
-

 Science2 weeks ago
Visualizing the Average Lifespans of Mammals
-

 Brands1 week ago
How Tech Logos Have Evolved Over Time