Markets
The World’s 100 Most Valuable Brands in 2021
View the full-size version of this graphic.
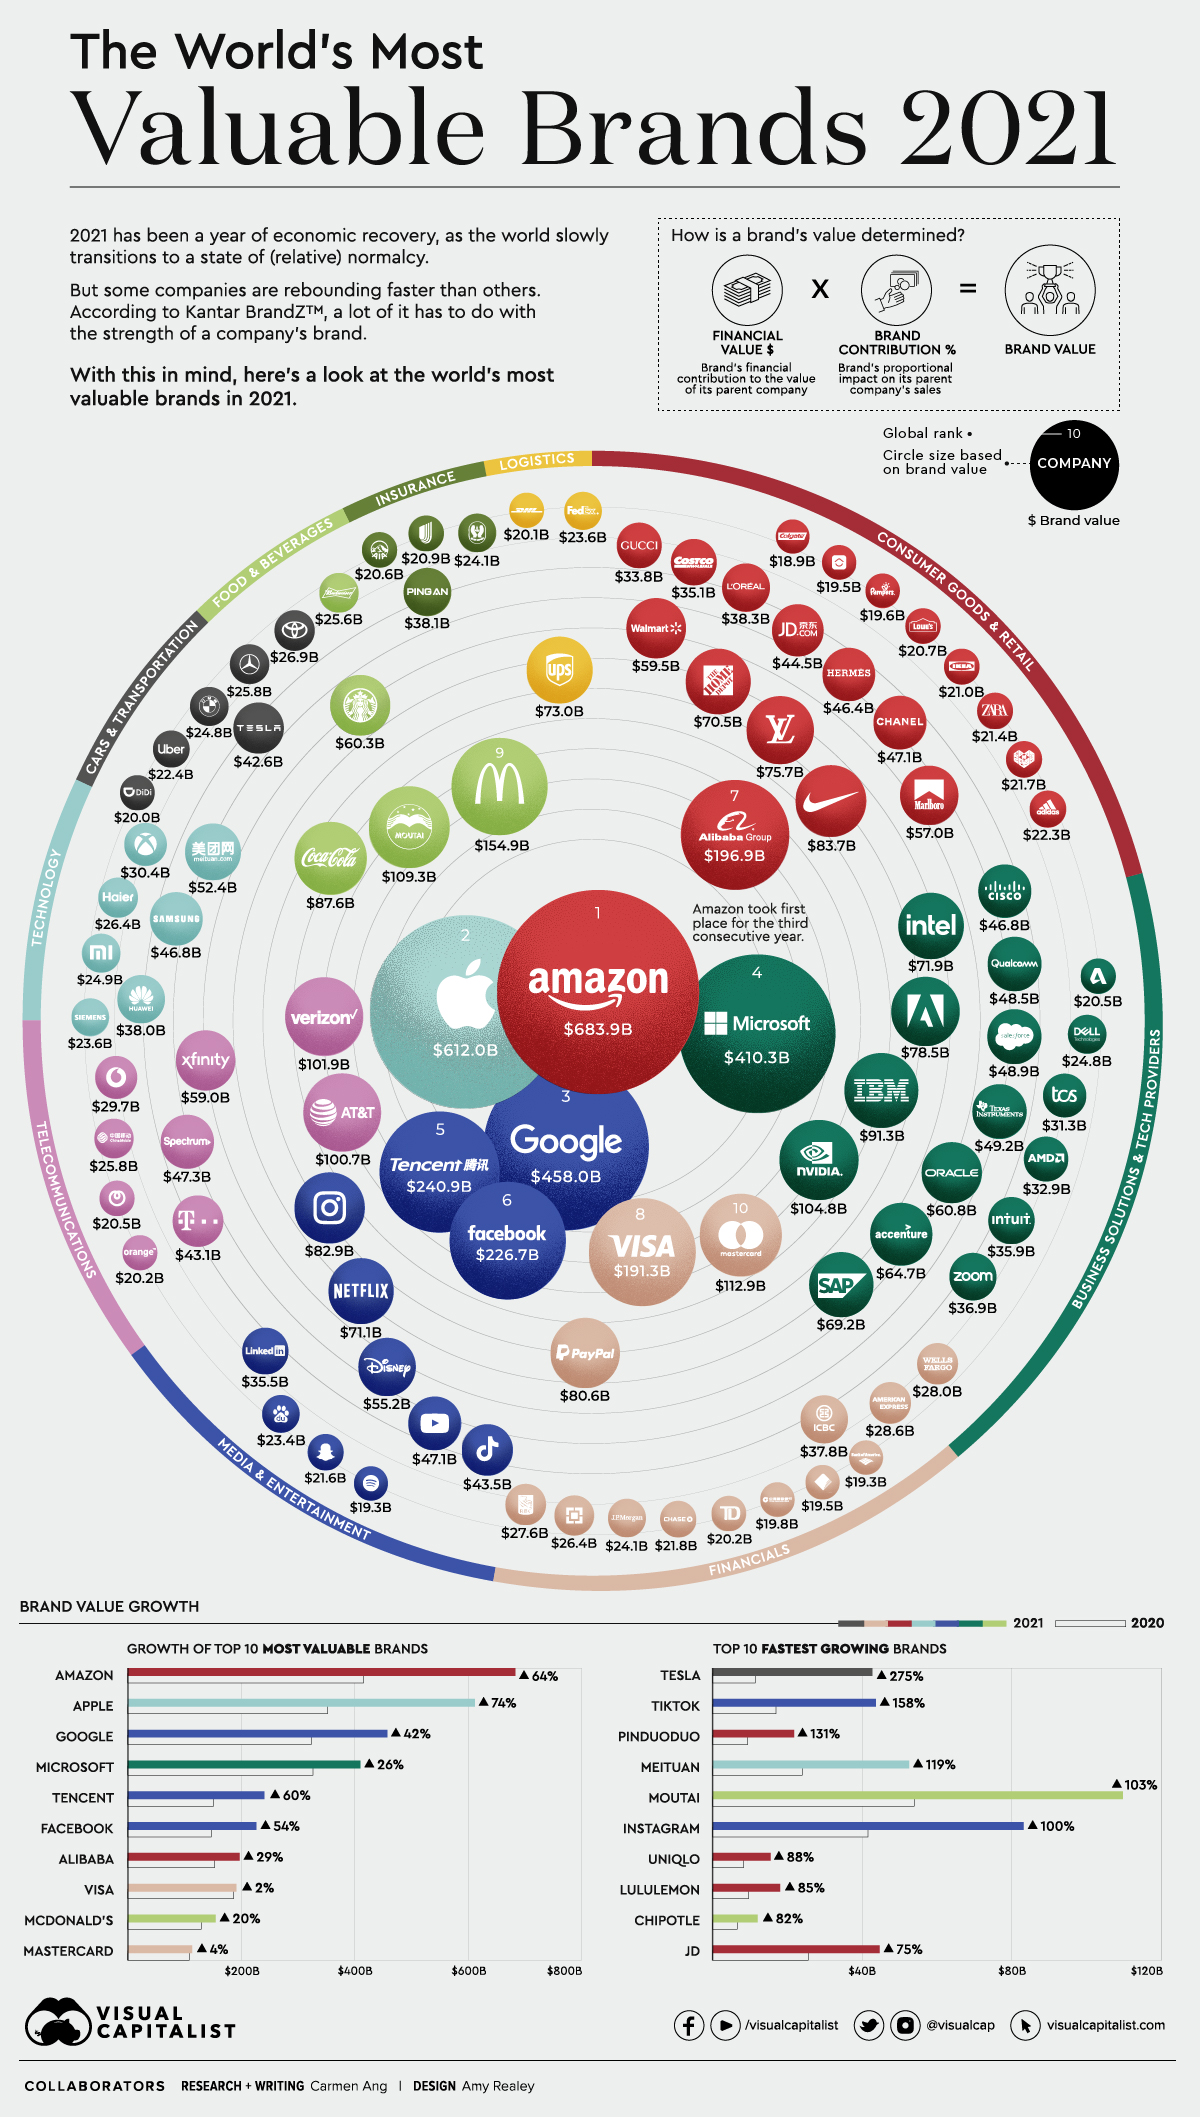


The World’s Top 100 Most Valuable Brands in 2021
In 2020, the global economy experienced one of the worst declines since the Great Depression.
Yet, while the ripple effects of COVID-19 have thrown many businesses into disarray, some companies have not only managed to stay afloat amidst the chaos—they’ve thrived. Using data from Kantar BrandZ, this graphic looks at the top 100 most valuable brands of 2021.
Methodology
Each year, research group Kantar BrandZ ranks companies based on their “brand value,” which is measured by:
- A brand’s total financial value, which is the financial contribution that brand brings to its parent company ($ value).
- Multiplied by its proportional value, measured by the brands proportional impact on its parent company’s sales (% value).
The financial results are then combined with quantitative survey data, sourced from over 170,000 global consumers. The end result is a holistic look at a company’s brand equity, reputation, and ability to generate value.
The Leaderboard
The total value of 2021’s Top 100 brands grew by 42%, reaching a combined $7 trillion. At the top of the list, perhaps unsurprisingly, is Amazon, with a total brand value of $683 billion.
| Rank | Brand | Brand Value ($B USD) | Category | Brand Value % change from 2020 |
|---|---|---|---|---|
| 1 | Amazon | $683.85 | Consumer Goods & Retail | 64% |
| 2 | Apple | $612.00 | Technology | 74% |
| 3 | $458.00 | Media & Entertainment | 42% | |
| 4 | Microsoft | $410.27 | Business Solutions & Tech Providers | 26% |
| 5 | Tencent | $240.93 | Media & Entertainment | 60% |
| 6 | $226.74 | Media & Entertainment | 54% | |
| 7 | Alibaba | $196.91 | Consumer Goods & Retail | 29% |
| 8 | Visa | $191.29 | Financial Services | 2% |
| 9 | McDonald's | $154.92 | Food & Beverages | 20% |
| 10 | Mastercard | $112.88 | Financial Services | 4% |
| 11 | Moutai | $109.33 | Food & Beverages | 103% |
| 12 | Nvidia | $104.76 | Business Solutions & Tech Providers | n/a |
| 13 | Verizon | $101.94 | Telecom Providers | 8% |
| 14 | AT&T | $100.65 | Telecom Providers | -5% |
| 15 | IBM | $91.34 | Business Solutions & Tech Providers | 9% |
| 16 | Coca-Cola | $87.60 | Food & Beverages | 4% |
| 17 | Nike | $83.71 | Consumer Goods & Retail | 68% |
| 18 | $82.90 | Media & Entertainment | 100% | |
| 19 | PayPal | $80.62 | Payments | 66% |
| 20 | Adobe | $78.52 | Business Solutions & Tech Providers | n/a |
| 21 | Louis Vuitton | $75.73 | Consumer Goods & Retail | 46% |
| 22 | UPS | $73.02 | Logistics | 44% |
| 23 | Intel | $71.94 | Business Solutions & Tech Providers | n/a |
| 24 | Netflix | $71.13 | Media & Entertainment | 55% |
| 25 | The Home Depot | $70.52 | Consumer Goods & Retail | 22% |
| 26 | SAP | $69.24 | Business Solutions & Tech Providers | 20% |
| 27 | Accenture | $64.73 | Business Solutions & Tech Providers | n/a |
| 28 | Oracle | $60.84 | Business Solutions & Tech Providers | n/a |
| 29 | Starbucks | $60.27 | Food & Beverages | 26% |
| 30 | Walmart | $59.52 | Consumer Goods & Retail | 30% |
| 31 | Xfinity | $59.00 | Telecom Providers | 26% |
| 32 | Marlboro | $57.01 | Consumer Goods & Retail | -2% |
| 33 | Disney | $55.22 | Media & Entertainment | 13% |
| 34 | Meituan | $52.40 | Technology | 119% |
| 35 | Texas Instruments | $49.24 | Business Solutions & Tech Providers | n/a |
| 36 | Salesforce | $48.98 | Business Solutions & Tech Providers | 61% |
| 37 | Qualcomm | $48.36 | Business Solutions & Tech Providers | n/a |
| 38 | Spectrum | $47.28 | Telecom Providers | 10% |
| 39 | YouTube | $47.10 | Media & Entertainment | 39% |
| 40 | Chanel | $47.05 | Consumer Goods & Retail | 30% |
| 41 | Cisco | $46.82 | Business Solutions & Tech Providers | n/a |
| 42 | Samsung | $46.77 | Technology | 44% |
| 43 | Hermès | $46.40 | Consumer Goods & Retail | 40% |
| 44 | JD | $44.52 | Consumer Goods & Retail | 75% |
| 45 | TikTok | $43.52 | Media & Entertainment | 158% |
| 46 | Deutsche Telekom | $43.10 | Telecom Providers | 16% |
| 47 | Tesla | $42.61 | Cars & Transportation | 275% |
| 48 | L'Oréal Paris | $38.31 | Consumer Goods & Retail | 30% |
| 49 | Ping An | $38.05 | Insurance | 13% |
| 50 | Huawei | $38.02 | Technology | 29% |
| 51 | ICBC | $37.77 | Financial Services | -1% |
| 52 | Zoom | $36.93 | Business Solutions & Tech Providers | n/a |
| 53 | Intuit | $35.87 | Business Solutions & Tech Providers | n/a |
| 54 | $35.52 | Media & Entertainment | 19% | |
| 55 | Costco | $35.14 | Consumer Goods & Retail | 23% |
| 56 | Gucci | $33.84 | Consumer Goods & Retail | 24% |
| 57 | AMD | $32.92 | Business Solutions & Tech Providers | n/a |
| 58 | Tata Consulting Services | $31.28 | Business Solutions & Tech Providers | n/a |
| 59 | Xbox | $30.40 | Technology | 55% |
| 60 | Vodafone | $29.74 | Telecom Providers | 29% |
| 61 | American Express | $28.58 | Financial Services | -3% |
| 62 | Wells Fargo | $28.00 | Financial Services | -8% |
| 63 | RBC | $27.61 | Financial Services | 33% |
| 64 | Toyota | $26.97 | Cars & Transportation | -5% |
| 65 | Haier | $26.42 | Technology | 41% |
| 66 | HDFC Bank | $26.37 | Financial Services | 27% |
| 67 | Mercedes-Benz | $25.84 | Cars & Transportation | 21% |
| 68 | China Mobile | $25.82 | Telecom Providers | -25% |
| 69 | Budweiser | $25.55 | Food & Beverages | 5% |
| 70 | Xiaomi | $24.89 | Technology | 50% |
| 71 | BMW | $24.82 | Cars & Transportation | 21% |
| 72 | Dell Technologies | $24.78 | Business Solutions & Tech Providers | 36% |
| 73 | LIC | $24.14 | Insurance | 38% |
| 74 | J.P. Morgan | $24.11 | Financial Services | 37% |
| 75 | Siemens | $23.64 | Conglomerate | 69% |
| 76 | Fedex | $23.59 | Logistics | 53% |
| 77 | Baidu | $23.36 | Media & Entertainment | 57% |
| 78 | Uber | $22.41 | Cars & Transportation | 41% |
| 79 | Adidas | $22.34 | Consumer Goods & Retail | 51% |
| 80 | Chase | $21.83 | Financial Services | 7% |
| 81 | Pinduoduo | $21.73 | Consumer Goods & Retail | 131% |
| 82 | Snapchat | $21.61 | Media & Entertainment | n/a |
| 83 | Zara | $21.38 | Consumer Goods & Retail | 0% |
| 84 | Ikea | $21.02 | Consumer Goods & Retail | 17% |
| 85 | UnitedHealthCare | $20.87 | Insurance | 32% |
| 86 | Lowe's | $20.67 | Consumer Goods & Retail | 51% |
| 87 | AIA | $20.60 | Insurance | 16% |
| 88 | NTT | $20.48 | Telecom Providers | 1% |
| 89 | Autodesk | $20.45 | Business Solutions & Tech Providers | n/a |
| 90 | TD | $20.21 | Financial Services | 17% |
| 91 | Orange | $20.20 | Telecom Providers | 4% |
| 92 | DHL | $20.14 | Logistics | 39% |
| 93 | Didi Chuxing | $20.04 | Cars & Transportation | 0% |
| 94 | China Construction Bank | $19.78 | Financial Services | -6% |
| 95 | Pampers | $19.62 | Consumer Goods & Retail | 6% |
| 96 | KE | $19.50 | Consumer Goods & Retail | n/a |
| 97 | Commonwealth Bank | $19.47 | Financial Services | 48% |
| 98 | Bank of America | $19.32 | Financial Services | 14% |
| 99 | Spotify | $19.28 | Media & Entertainment | n/a |
| 100 | Colgate | $18.89 | Consumer Goods & Retail | 8% |
It’s the third consecutive year that Amazon has placed first on the list. Since last year’s ranking, the ecommerce brand has seen its value grow by 64%. Keep in mind, this accounts for all areas of Amazon’s business, including its web and subscription services.
Second on the list is Apple with a brand value of $612 billion. Apple wasn’t completely immune to the impacts of COVID-19—in the early days of the pandemic, its stock dipped almost 19% from record highs—but the company recovered and reported record-breaking revenue, generating $64.7 billion in Q4 2020.
It’s fitting that the top brands on the list are big tech companies since the pandemic pushed consumers online for both their shopping and entertainment needs. A few social media platforms placed high on the list as well, like Facebook, which rose two ranks this year to score the sixth spot with a brand value of $227 billion.
Instagram and TikTok trailed behind Facebook when it came to total brand value, but both platforms saw exceptional growth compared to last year’s report. In fact, when looking at brand value growth from 2020, both brands scored a spot in the top 10.
Insights into Brand Value Growth
The most valuable brand report has been ranking companies for over a decade, and some overarching factors have stood out as key contributors to brand value growth:
1. The Big Get Bigger
Starting “strong” can give brands an edge. This is because growth rate is closely correlated with high brand equity. In other words, a strong brand will likely see more growth than a weaker brand, which might explain why companies like Amazon and Apple have been able to hold their place at the top for several consecutive years.
Keep in mind, this doesn’t account for industry disruptors. An innovative company could come out of the woodwork next year and give the Big Tech giants a run for their money.
2. Marketing Makes a Difference
The right strategy can make a difference, and even smaller brands can make a splash if the message is impactful. Brands with emotional associations, like pride or popularity, tend to see that translate into brand value growth.
Companies like Nike and Coca-Cola have mastered the art of emotional advertising. For instance, in May last year, Nike released a video urging consumers to stand up for equality, in a video titled, “For Once, Just Don’t Do It.”
3. Smart Investment
It’s not just about developing an effective marketing strategy, it’s about executing that strategy, and continually investing in ways that perpetuate your brand message.
For instance, innovation is the core value of Tesla’s brand, and the electric car company walks the walk—in 2020, the company spent $1.5 billion on R&D.


Markets
Mapped: Europe’s GDP Per Capita, by Country
Which European economies are richest on a GDP per capita basis? This map shows the results for 44 countries across the continent.


Mapped: Europe’s GDP Per Capita, by Country (2024)
This was originally posted on our Voronoi app. Download the app for free on iOS or Android and discover incredible data-driven charts from a variety of trusted sources.
Europe is home to some of the largest and most sophisticated economies in the world. But how do countries in the region compare with each other on a per capita productivity basis?
In this map, we show Europe’s GDP per capita levels across 44 nations in current U.S. dollars. Data for this visualization and article is sourced from the International Monetary Fund (IMF) via their DataMapper tool, updated April 2024.
Europe’s Richest and Poorest Nations, By GDP Per Capita
Luxembourg, Ireland, and Switzerland, lead the list of Europe’s richest nations by GDP per capita, all above $100,000.
| Rank | Country | GDP Per Capita (2024) |
|---|---|---|
| 1 | 🇱🇺 Luxembourg | $131,380 |
| 2 | 🇮🇪 Ireland | $106,060 |
| 3 | 🇨🇭 Switzerland | $105,670 |
| 4 | 🇳🇴 Norway | $94,660 |
| 5 | 🇮🇸 Iceland | $84,590 |
| 6 | 🇩🇰 Denmark | $68,900 |
| 7 | 🇳🇱 Netherlands | $63,750 |
| 8 | 🇸🇲 San Marino | $59,410 |
| 9 | 🇦🇹 Austria | $59,230 |
| 10 | 🇸🇪 Sweden | $58,530 |
| 11 | 🇧🇪 Belgium | $55,540 |
| 12 | 🇫🇮 Finland | $55,130 |
| 13 | 🇩🇪 Germany | $54,290 |
| 14 | 🇬🇧 UK | $51,070 |
| 15 | 🇫🇷 France | $47,360 |
| 16 | 🇦🇩 Andorra | $44,900 |
| 17 | 🇲🇹 Malta | $41,740 |
| 18 | 🇮🇹 Italy | $39,580 |
| 19 | 🇨🇾 Cyprus | $37,150 |
| 20 | 🇪🇸 Spain | $34,050 |
| 21 | 🇸🇮 Slovenia | $34,030 |
| 22 | 🇪🇪 Estonia | $31,850 |
| 23 | 🇨🇿 Czech Republic | $29,800 |
| 24 | 🇵🇹 Portugal | $28,970 |
| 25 | 🇱🇹 Lithuania | $28,410 |
| 26 | 🇸🇰 Slovakia | $25,930 |
| 27 | 🇱🇻 Latvia | $24,190 |
| 28 | 🇬🇷 Greece | $23,970 |
| 29 | 🇭🇺 Hungary | $23,320 |
| 30 | 🇵🇱 Poland | $23,010 |
| 31 | 🇭🇷 Croatia | $22,970 |
| 32 | 🇷🇴 Romania | $19,530 |
| 33 | 🇧🇬 Bulgaria | $16,940 |
| 34 | 🇷🇺 Russia | $14,390 |
| 35 | 🇹🇷 Türkiye | $12,760 |
| 36 | 🇲🇪 Montenegro | $12,650 |
| 37 | 🇷🇸 Serbia | $12,380 |
| 38 | 🇦🇱 Albania | $8,920 |
| 39 | 🇧🇦 Bosnia & Herzegovina | $8,420 |
| 40 | 🇲🇰 North Macedonia | $7,690 |
| 41 | 🇧🇾 Belarus | $7,560 |
| 42 | 🇲🇩 Moldova | $7,490 |
| 43 | 🇽🇰 Kosovo | $6,390 |
| 44 | 🇺🇦 Ukraine | $5,660 |
| N/A | 🇪🇺 EU Average | $44,200 |
Note: Figures are rounded.
Three Nordic countries (Norway, Iceland, Denmark) also place highly, between $70,000-90,000. Other Nordic peers, Sweden and Finland rank just outside the top 10, between $55,000-60,000.
Meanwhile, Europe’s biggest economies in absolute terms, Germany, UK, and France, rank closer to the middle of the top 20, with GDP per capitas around $50,000.
Finally, at the end of the scale, Eastern Europe as a whole tends to have much lower per capita GDPs. In that group, Ukraine ranks last, at $5,660.
A Closer Look at Ukraine
For a broader comparison, Ukraine’s per capita GDP is similar to Iran ($5,310), El Salvador ($5,540), and Guatemala ($5,680).
According to experts, Ukraine’s economy has historically underperformed to expectations. After the fall of the Berlin Wall, the economy contracted for five straight years. Its transition to a Western, liberalized economic structure was overshadowed by widespread corruption, a limited taxpool, and few revenue sources.
Politically, its transformation from authoritarian regime to civil democracy has proved difficult, especially when it comes to institution building.
Finally, after the 2022 invasion of the country, Ukraine’s GDP contracted by 30% in a single year—the largest loss since independence. Large scale emigration—to the tune of six million refugees—is also playing a role.
Despite these challenges, the country’s economic growth has somewhat stabilized while fighting continues.

-

 Markets6 days ago
Visualized: Interest Rate Forecasts for Advanced Economies
-

 Markets2 weeks ago
Economic Growth Forecasts for G7 and BRICS Countries in 2024
-

 Wealth2 weeks ago
Charted: Which City Has the Most Billionaires in 2024?
-

 Technology2 weeks ago
All of the Grants Given by the U.S. CHIPS Act
-

 Green2 weeks ago
The Carbon Footprint of Major Travel Methods
-

 United States1 week ago
Visualizing the Most Common Pets in the U.S.
-

 Culture1 week ago
The World’s Top Media Franchises by All-Time Revenue
-

 voronoi1 week ago
Best Visualizations of April on the Voronoi App