Markets
The World’s 100 Most Valuable Brands in 2021
View the full-size version of this graphic.
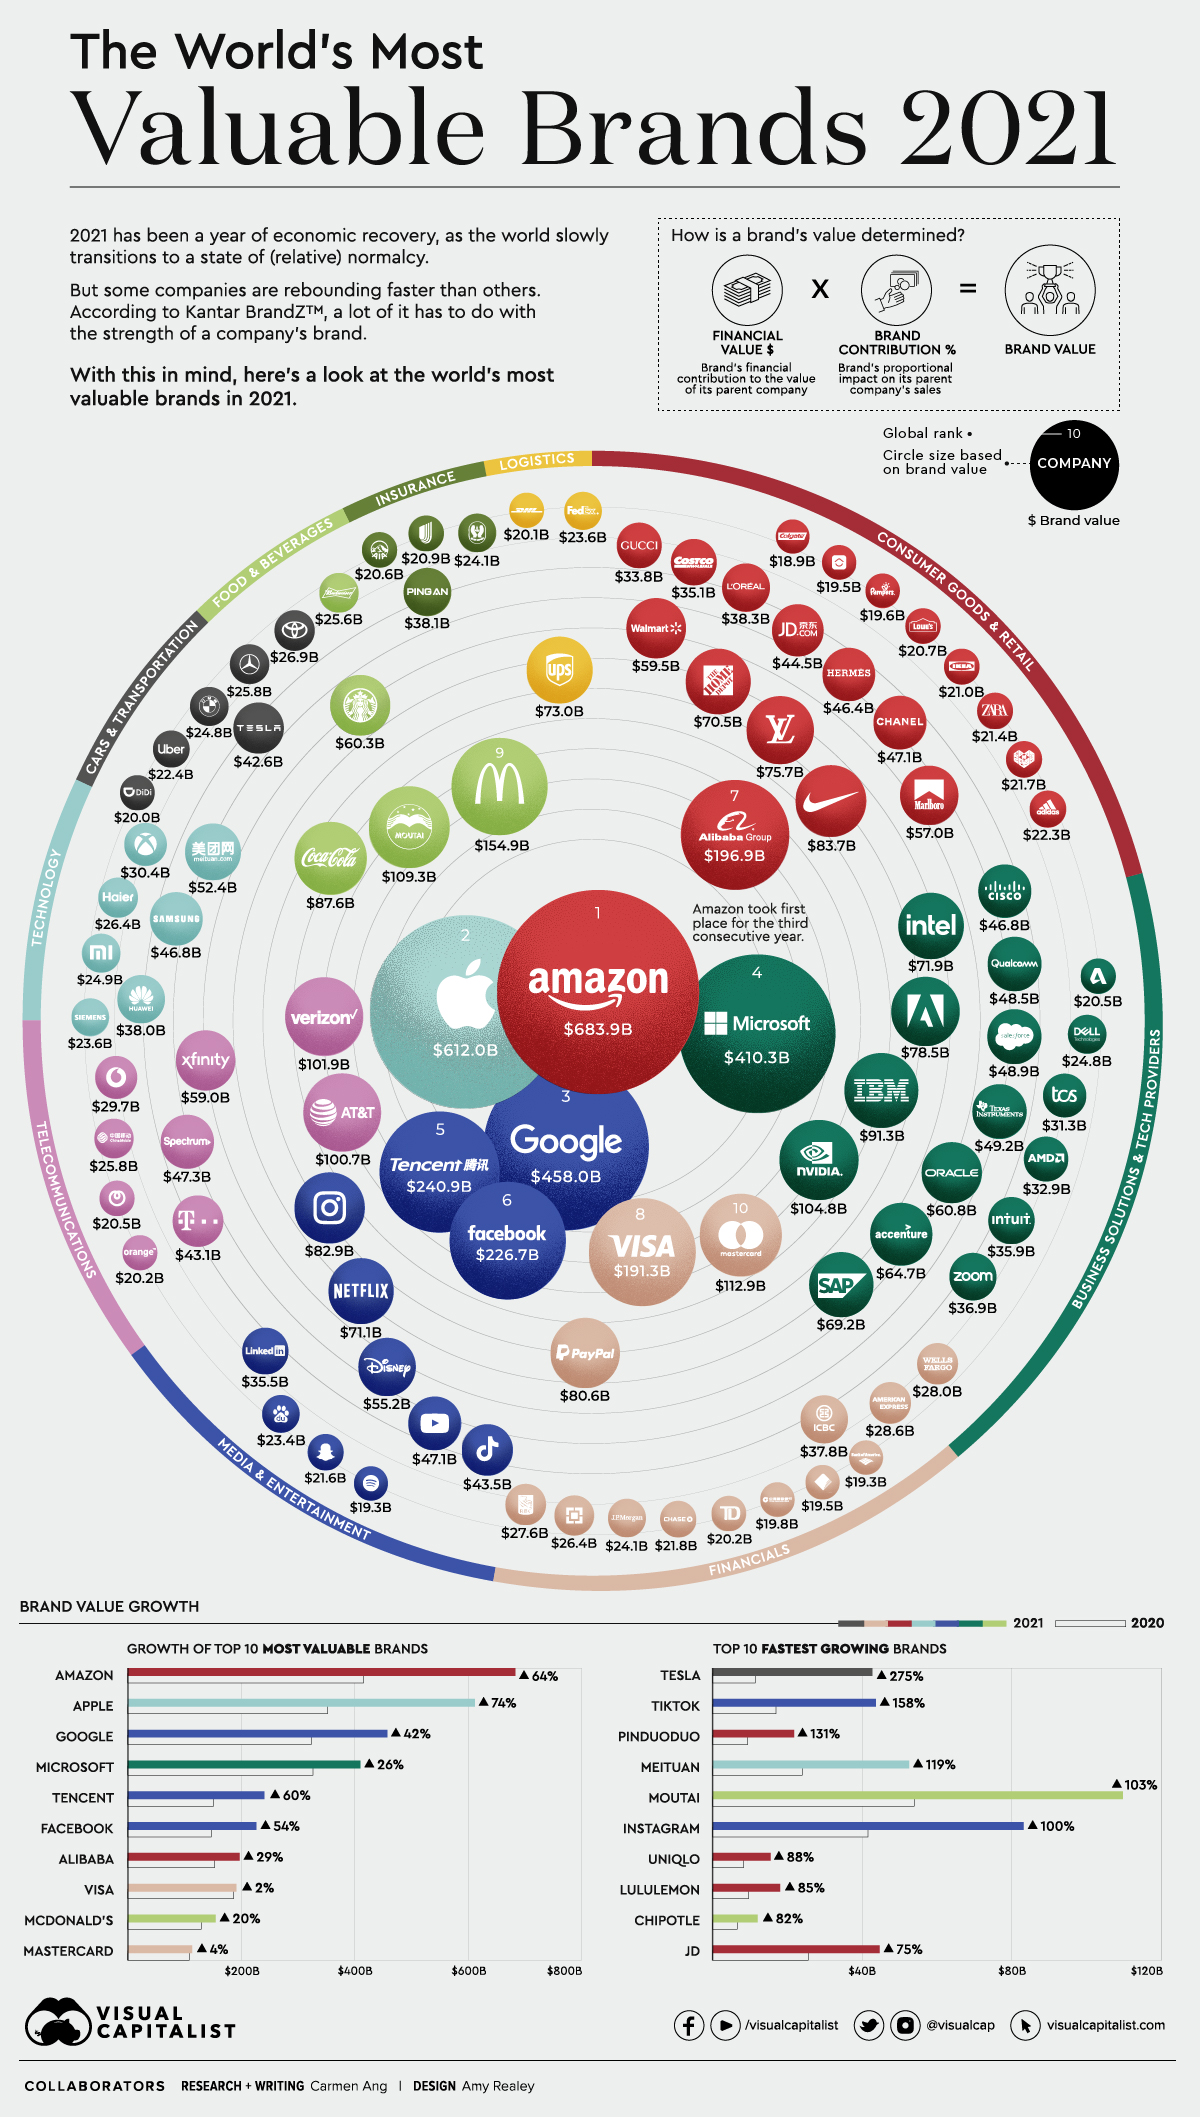


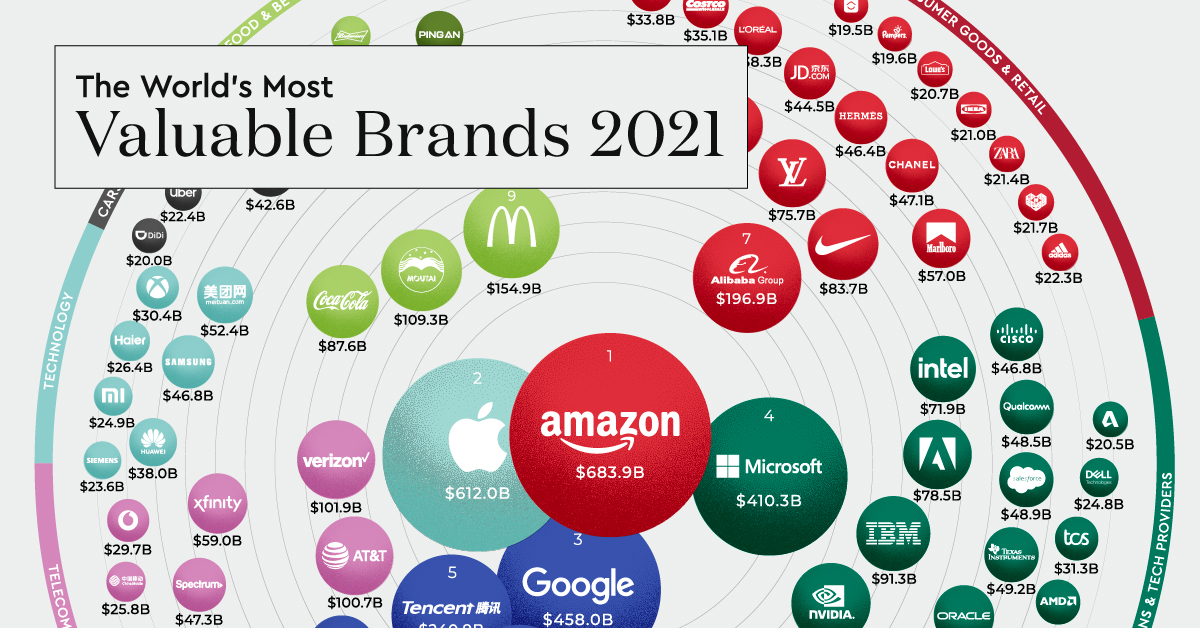
The World’s Top 100 Most Valuable Brands in 2021
In 2020, the global economy experienced one of the worst declines since the Great Depression.
Yet, while the ripple effects of COVID-19 have thrown many businesses into disarray, some companies have not only managed to stay afloat amidst the chaos—they’ve thrived. Using data from Kantar BrandZ, this graphic looks at the top 100 most valuable brands of 2021.
Methodology
Each year, research group Kantar BrandZ ranks companies based on their “brand value,” which is measured by:
- A brand’s total financial value, which is the financial contribution that brand brings to its parent company ($ value).
- Multiplied by its proportional value, measured by the brands proportional impact on its parent company’s sales (% value).
The financial results are then combined with quantitative survey data, sourced from over 170,000 global consumers. The end result is a holistic look at a company’s brand equity, reputation, and ability to generate value.
The Leaderboard
The total value of 2021’s Top 100 brands grew by 42%, reaching a combined $7 trillion. At the top of the list, perhaps unsurprisingly, is Amazon, with a total brand value of $683 billion.
| Rank | Brand | Brand Value ($B USD) | Category | Brand Value % change from 2020 |
|---|---|---|---|---|
| 1 | Amazon | $683.85 | Consumer Goods & Retail | 64% |
| 2 | Apple | $612.00 | Technology | 74% |
| 3 | $458.00 | Media & Entertainment | 42% | |
| 4 | Microsoft | $410.27 | Business Solutions & Tech Providers | 26% |
| 5 | Tencent | $240.93 | Media & Entertainment | 60% |
| 6 | $226.74 | Media & Entertainment | 54% | |
| 7 | Alibaba | $196.91 | Consumer Goods & Retail | 29% |
| 8 | Visa | $191.29 | Financial Services | 2% |
| 9 | McDonald's | $154.92 | Food & Beverages | 20% |
| 10 | Mastercard | $112.88 | Financial Services | 4% |
| 11 | Moutai | $109.33 | Food & Beverages | 103% |
| 12 | Nvidia | $104.76 | Business Solutions & Tech Providers | n/a |
| 13 | Verizon | $101.94 | Telecom Providers | 8% |
| 14 | AT&T | $100.65 | Telecom Providers | -5% |
| 15 | IBM | $91.34 | Business Solutions & Tech Providers | 9% |
| 16 | Coca-Cola | $87.60 | Food & Beverages | 4% |
| 17 | Nike | $83.71 | Consumer Goods & Retail | 68% |
| 18 | $82.90 | Media & Entertainment | 100% | |
| 19 | PayPal | $80.62 | Payments | 66% |
| 20 | Adobe | $78.52 | Business Solutions & Tech Providers | n/a |
| 21 | Louis Vuitton | $75.73 | Consumer Goods & Retail | 46% |
| 22 | UPS | $73.02 | Logistics | 44% |
| 23 | Intel | $71.94 | Business Solutions & Tech Providers | n/a |
| 24 | Netflix | $71.13 | Media & Entertainment | 55% |
| 25 | The Home Depot | $70.52 | Consumer Goods & Retail | 22% |
| 26 | SAP | $69.24 | Business Solutions & Tech Providers | 20% |
| 27 | Accenture | $64.73 | Business Solutions & Tech Providers | n/a |
| 28 | Oracle | $60.84 | Business Solutions & Tech Providers | n/a |
| 29 | Starbucks | $60.27 | Food & Beverages | 26% |
| 30 | Walmart | $59.52 | Consumer Goods & Retail | 30% |
| 31 | Xfinity | $59.00 | Telecom Providers | 26% |
| 32 | Marlboro | $57.01 | Consumer Goods & Retail | -2% |
| 33 | Disney | $55.22 | Media & Entertainment | 13% |
| 34 | Meituan | $52.40 | Technology | 119% |
| 35 | Texas Instruments | $49.24 | Business Solutions & Tech Providers | n/a |
| 36 | Salesforce | $48.98 | Business Solutions & Tech Providers | 61% |
| 37 | Qualcomm | $48.36 | Business Solutions & Tech Providers | n/a |
| 38 | Spectrum | $47.28 | Telecom Providers | 10% |
| 39 | YouTube | $47.10 | Media & Entertainment | 39% |
| 40 | Chanel | $47.05 | Consumer Goods & Retail | 30% |
| 41 | Cisco | $46.82 | Business Solutions & Tech Providers | n/a |
| 42 | Samsung | $46.77 | Technology | 44% |
| 43 | Hermès | $46.40 | Consumer Goods & Retail | 40% |
| 44 | JD | $44.52 | Consumer Goods & Retail | 75% |
| 45 | TikTok | $43.52 | Media & Entertainment | 158% |
| 46 | Deutsche Telekom | $43.10 | Telecom Providers | 16% |
| 47 | Tesla | $42.61 | Cars & Transportation | 275% |
| 48 | L'Oréal Paris | $38.31 | Consumer Goods & Retail | 30% |
| 49 | Ping An | $38.05 | Insurance | 13% |
| 50 | Huawei | $38.02 | Technology | 29% |
| 51 | ICBC | $37.77 | Financial Services | -1% |
| 52 | Zoom | $36.93 | Business Solutions & Tech Providers | n/a |
| 53 | Intuit | $35.87 | Business Solutions & Tech Providers | n/a |
| 54 | $35.52 | Media & Entertainment | 19% | |
| 55 | Costco | $35.14 | Consumer Goods & Retail | 23% |
| 56 | Gucci | $33.84 | Consumer Goods & Retail | 24% |
| 57 | AMD | $32.92 | Business Solutions & Tech Providers | n/a |
| 58 | Tata Consulting Services | $31.28 | Business Solutions & Tech Providers | n/a |
| 59 | Xbox | $30.40 | Technology | 55% |
| 60 | Vodafone | $29.74 | Telecom Providers | 29% |
| 61 | American Express | $28.58 | Financial Services | -3% |
| 62 | Wells Fargo | $28.00 | Financial Services | -8% |
| 63 | RBC | $27.61 | Financial Services | 33% |
| 64 | Toyota | $26.97 | Cars & Transportation | -5% |
| 65 | Haier | $26.42 | Technology | 41% |
| 66 | HDFC Bank | $26.37 | Financial Services | 27% |
| 67 | Mercedes-Benz | $25.84 | Cars & Transportation | 21% |
| 68 | China Mobile | $25.82 | Telecom Providers | -25% |
| 69 | Budweiser | $25.55 | Food & Beverages | 5% |
| 70 | Xiaomi | $24.89 | Technology | 50% |
| 71 | BMW | $24.82 | Cars & Transportation | 21% |
| 72 | Dell Technologies | $24.78 | Business Solutions & Tech Providers | 36% |
| 73 | LIC | $24.14 | Insurance | 38% |
| 74 | J.P. Morgan | $24.11 | Financial Services | 37% |
| 75 | Siemens | $23.64 | Conglomerate | 69% |
| 76 | Fedex | $23.59 | Logistics | 53% |
| 77 | Baidu | $23.36 | Media & Entertainment | 57% |
| 78 | Uber | $22.41 | Cars & Transportation | 41% |
| 79 | Adidas | $22.34 | Consumer Goods & Retail | 51% |
| 80 | Chase | $21.83 | Financial Services | 7% |
| 81 | Pinduoduo | $21.73 | Consumer Goods & Retail | 131% |
| 82 | Snapchat | $21.61 | Media & Entertainment | n/a |
| 83 | Zara | $21.38 | Consumer Goods & Retail | 0% |
| 84 | Ikea | $21.02 | Consumer Goods & Retail | 17% |
| 85 | UnitedHealthCare | $20.87 | Insurance | 32% |
| 86 | Lowe's | $20.67 | Consumer Goods & Retail | 51% |
| 87 | AIA | $20.60 | Insurance | 16% |
| 88 | NTT | $20.48 | Telecom Providers | 1% |
| 89 | Autodesk | $20.45 | Business Solutions & Tech Providers | n/a |
| 90 | TD | $20.21 | Financial Services | 17% |
| 91 | Orange | $20.20 | Telecom Providers | 4% |
| 92 | DHL | $20.14 | Logistics | 39% |
| 93 | Didi Chuxing | $20.04 | Cars & Transportation | 0% |
| 94 | China Construction Bank | $19.78 | Financial Services | -6% |
| 95 | Pampers | $19.62 | Consumer Goods & Retail | 6% |
| 96 | KE | $19.50 | Consumer Goods & Retail | n/a |
| 97 | Commonwealth Bank | $19.47 | Financial Services | 48% |
| 98 | Bank of America | $19.32 | Financial Services | 14% |
| 99 | Spotify | $19.28 | Media & Entertainment | n/a |
| 100 | Colgate | $18.89 | Consumer Goods & Retail | 8% |
It’s the third consecutive year that Amazon has placed first on the list. Since last year’s ranking, the ecommerce brand has seen its value grow by 64%. Keep in mind, this accounts for all areas of Amazon’s business, including its web and subscription services.
Second on the list is Apple with a brand value of $612 billion. Apple wasn’t completely immune to the impacts of COVID-19—in the early days of the pandemic, its stock dipped almost 19% from record highs—but the company recovered and reported record-breaking revenue, generating $64.7 billion in Q4 2020.
It’s fitting that the top brands on the list are big tech companies since the pandemic pushed consumers online for both their shopping and entertainment needs. A few social media platforms placed high on the list as well, like Facebook, which rose two ranks this year to score the sixth spot with a brand value of $227 billion.
Instagram and TikTok trailed behind Facebook when it came to total brand value, but both platforms saw exceptional growth compared to last year’s report. In fact, when looking at brand value growth from 2020, both brands scored a spot in the top 10.
Insights into Brand Value Growth
The most valuable brand report has been ranking companies for over a decade, and some overarching factors have stood out as key contributors to brand value growth:
1. The Big Get Bigger
Starting “strong” can give brands an edge. This is because growth rate is closely correlated with high brand equity. In other words, a strong brand will likely see more growth than a weaker brand, which might explain why companies like Amazon and Apple have been able to hold their place at the top for several consecutive years.
Keep in mind, this doesn’t account for industry disruptors. An innovative company could come out of the woodwork next year and give the Big Tech giants a run for their money.
2. Marketing Makes a Difference
The right strategy can make a difference, and even smaller brands can make a splash if the message is impactful. Brands with emotional associations, like pride or popularity, tend to see that translate into brand value growth.
Companies like Nike and Coca-Cola have mastered the art of emotional advertising. For instance, in May last year, Nike released a video urging consumers to stand up for equality, in a video titled, “For Once, Just Don’t Do It.”
3. Smart Investment
It’s not just about developing an effective marketing strategy, it’s about executing that strategy, and continually investing in ways that perpetuate your brand message.
For instance, innovation is the core value of Tesla’s brand, and the electric car company walks the walk—in 2020, the company spent $1.5 billion on R&D.


Markets
The European Stock Market: Attractive Valuations Offer Opportunities
On average, the European stock market has valuations that are nearly 50% lower than U.S. valuations. But how can you access the market?


European Stock Market: Attractive Valuations Offer Opportunities
Europe is known for some established brands, from L’Oréal to Louis Vuitton. However, the European stock market offers additional opportunities that may be lesser known.
The above infographic, sponsored by STOXX, outlines why investors may want to consider European stocks.
Attractive Valuations
Compared to most North American and Asian markets, European stocks offer lower or comparable valuations.
| Index | Price-to-Earnings Ratio | Price-to-Book Ratio |
|---|---|---|
| EURO STOXX 50 | 14.9 | 2.2 |
| STOXX Europe 600 | 14.4 | 2 |
| U.S. | 25.9 | 4.7 |
| Canada | 16.1 | 1.8 |
| Japan | 15.4 | 1.6 |
| Asia Pacific ex. China | 17.1 | 1.8 |
Data as of February 29, 2024. See graphic for full index names. Ratios based on trailing 12 month financials. The price to earnings ratio excludes companies with negative earnings.
On average, European valuations are nearly 50% lower than U.S. valuations, potentially offering an affordable entry point for investors.
Research also shows that lower price ratios have historically led to higher long-term returns.
Market Movements Not Closely Connected
Over the last decade, the European stock market had low-to-moderate correlation with North American and Asian equities.
The below chart shows correlations from February 2014 to February 2024. A value closer to zero indicates low correlation, while a value of one would indicate that two regions are moving in perfect unison.
| EURO STOXX 50 | STOXX EUROPE 600 | U.S. | Canada | Japan | Asia Pacific ex. China |
|
|---|---|---|---|---|---|---|
| EURO STOXX 50 | 1.00 | 0.97 | 0.55 | 0.67 | 0.24 | 0.43 |
| STOXX EUROPE 600 | 1.00 | 0.56 | 0.71 | 0.28 | 0.48 | |
| U.S. | 1.00 | 0.73 | 0.12 | 0.25 | ||
| Canada | 1.00 | 0.22 | 0.40 | |||
| Japan | 1.00 | 0.88 | ||||
| Asia Pacific ex. China | 1.00 |
Data is based on daily USD returns.
European equities had relatively independent market movements from North American and Asian markets. One contributing factor could be the differing sector weights in each market. For instance, technology makes up a quarter of the U.S. market, but health care and industrials dominate the broader European market.
Ultimately, European equities can enhance portfolio diversification and have the potential to mitigate risk for investors.
Tracking the Market
For investors interested in European equities, STOXX offers a variety of flagship indices:
| Index | Description | Market Cap |
|---|---|---|
| STOXX Europe 600 | Pan-regional, broad market | €10.5T |
| STOXX Developed Europe | Pan-regional, broad-market | €9.9T |
| STOXX Europe 600 ESG-X | Pan-regional, broad market, sustainability focus | €9.7T |
| STOXX Europe 50 | Pan-regional, blue-chip | €5.1T |
| EURO STOXX 50 | Eurozone, blue-chip | €3.5T |
Data is as of February 29, 2024. Market cap is free float, which represents the shares that are readily available for public trading on stock exchanges.
The EURO STOXX 50 tracks the Eurozone’s biggest and most traded companies. It also underlies one of the world’s largest ranges of ETFs and mutual funds. As of November 2023, there were €27.3 billion in ETFs and €23.5B in mutual fund assets under management tracking the index.
“For the past 25 years, the EURO STOXX 50 has served as an accurate, reliable and tradable representation of the Eurozone equity market.”
— Axel Lomholt, General Manager at STOXX
Partnering with STOXX to Track the European Stock Market
Are you interested in European equities? STOXX can be a valuable partner:
- Comprehensive, liquid and investable ecosystem
- European heritage, global reach
- Highly sophisticated customization capabilities
- Open architecture approach to using data
- Close partnerships with clients
- Part of ISS STOXX and Deutsche Börse Group
With a full suite of indices, STOXX can help you benchmark against the European stock market.
Learn how STOXX’s European indices offer liquid and effective market access.

-

 Economy1 day ago
Economic Growth Forecasts for G7 and BRICS Countries in 2024
The IMF has released its economic growth forecasts for 2024. How do the G7 and BRICS countries compare?
-

 Markets1 week ago
U.S. Debt Interest Payments Reach $1 Trillion
U.S. debt interest payments have surged past the $1 trillion dollar mark, amid high interest rates and an ever-expanding debt burden.
-

 United States1 week ago
Ranked: The Largest U.S. Corporations by Number of Employees
We visualized the top U.S. companies by employees, revealing the massive scale of retailers like Walmart, Target, and Home Depot.
-

 Markets2 weeks ago
The Top 10 States by Real GDP Growth in 2023
This graphic shows the states with the highest real GDP growth rate in 2023, largely propelled by the oil and gas boom.
-

 Markets2 weeks ago
Ranked: The World’s Top Flight Routes, by Revenue
In this graphic, we show the highest earning flight routes globally as air travel continued to rebound in 2023.
-

 Markets2 weeks ago
Ranked: The Most Valuable Housing Markets in America
The U.S. residential real estate market is worth a staggering $47.5 trillion. Here are the most valuable housing markets in the country.

-

 Mining1 week ago
Gold vs. S&P 500: Which Has Grown More Over Five Years?
-
Markets2 weeks ago
Ranked: The Most Valuable Housing Markets in America
-

 Money2 weeks ago
Which States Have the Highest Minimum Wage in America?
-

 AI2 weeks ago
Ranked: Semiconductor Companies by Industry Revenue Share
-
Markets2 weeks ago
Ranked: The World’s Top Flight Routes, by Revenue
-

 Demographics2 weeks ago
Population Projections: The World’s 6 Largest Countries in 2075
-
Markets2 weeks ago
The Top 10 States by Real GDP Growth in 2023
-

 Demographics2 weeks ago
The Smallest Gender Wage Gaps in OECD Countries