Chart of the Week
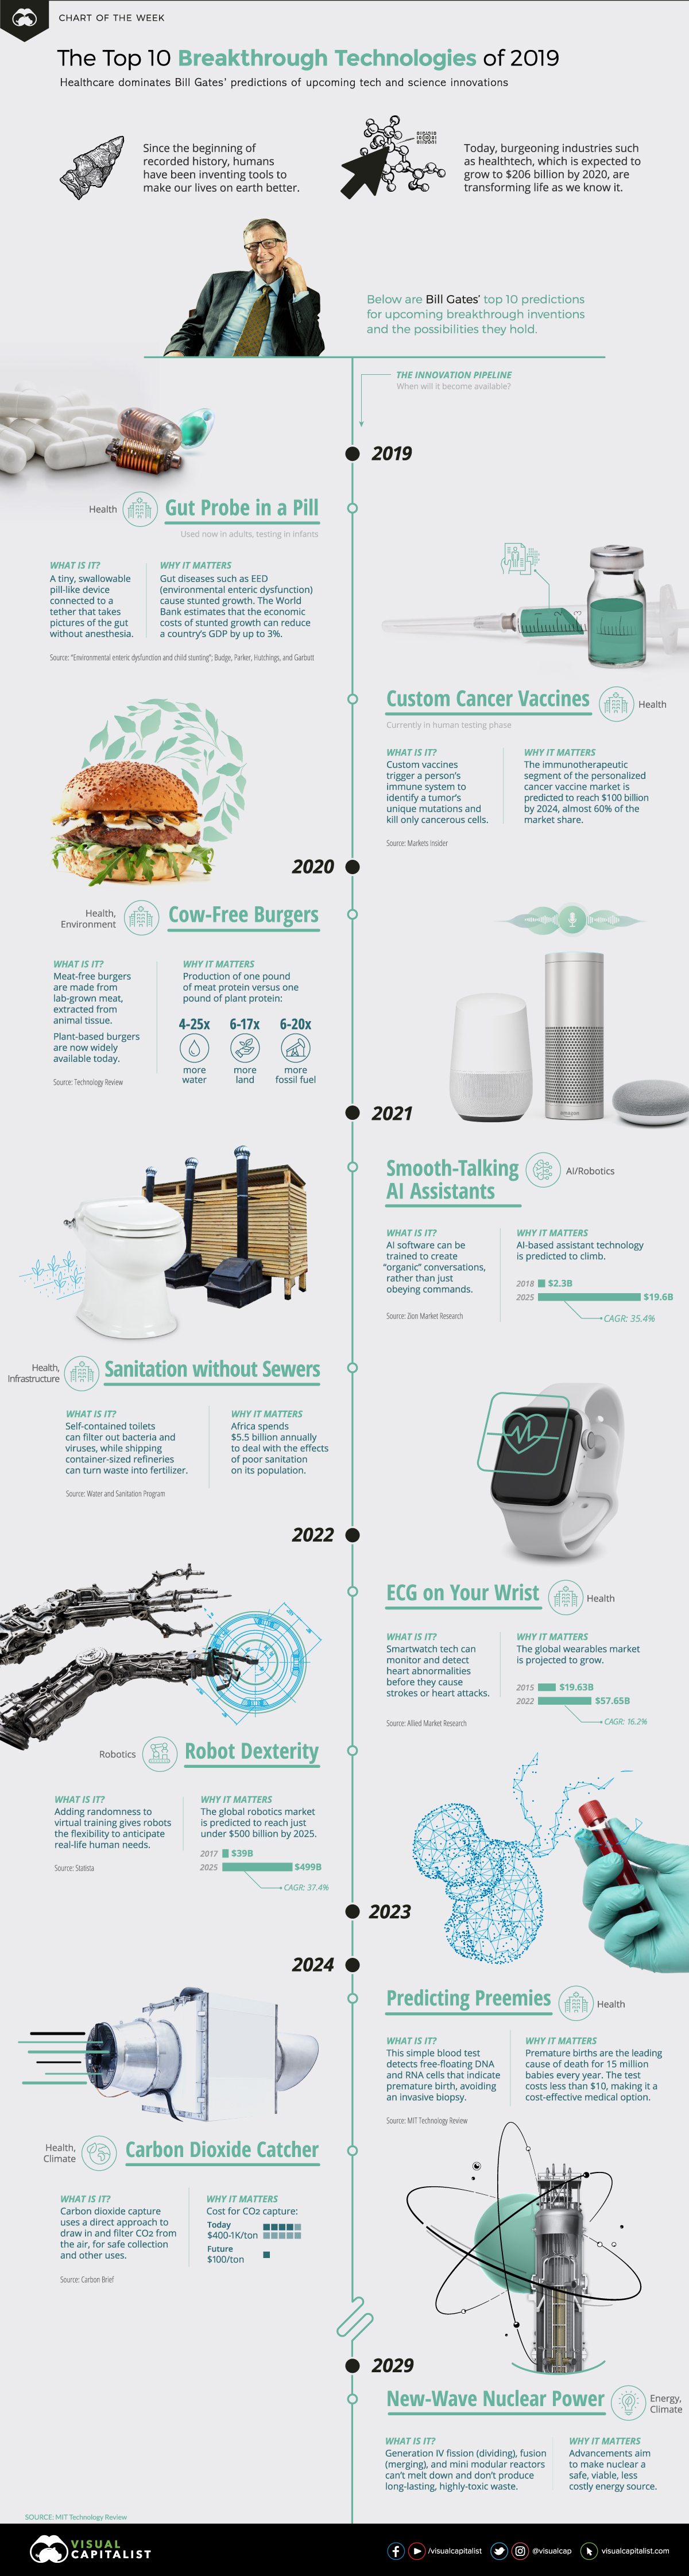
The 10 Breakthrough Technologies That Will Define 2019
The 10 Breakthrough Technologies That Will Define 2019
Gone are the days of turning stones into spears. With the advent of new technologies, we’ve learned to develop tools that not only make living faster and easier every day, but also improve the future of humanity as a whole.
Today’s Chart of the Week draws from the MIT Technology Review, which features Bill Gates’ predictions for the top 10 breakthrough inventions that will capture headlines in 2019.
Top 10 Breakthrough Technologies
1. Gut Probe in a Pill
These swallowable devices can detect and potentially prevent diseases that cause malnutrition and stunted growth in millions of children worldwide.
2. Custom Cancer Vaccines
Personalized cancer vaccines, targeting only the cancerous cells and leave healthy cells alone, could help ensure faster recovery times and pose fewer risks to patients.
3. Meat-free Burgers
Plant-based and lab-grown food products will ideally alleviate the environmental impact of the livestock industry.
4. Smooth-talking AI assistants
The AI assistants of the future will have even more human-like conversations to personally engage customers. Companies would see measurable benefits, with just one breakthrough here garnering a 5% jump in productivity.
5. Sanitation without sewers
Improperly drained sewage causes death in one out of every nine children. Sanitation that doesn’t require sewers would not only prevent exposure diseases but also help turn waste into useful products like fertilizer.
6. ECG on your wrist
While most medical ECGS have up to 12 nodes to detect abnormalities, today’s wearables typically have only one. An ECG on the wrist would help reduce the risk of heart disease by monitoring changes and patterns in daily life.
7. Robot Dexterity
Advancements in robotics will enable the natural dexterity required to complete a greater range of tasks, such as helping an ailing loved one out of bed, doing the laundry, or building toys.
8. Predicting Preemies
Premature births are the leading cause of death for children under five years old. Tests to detect the possibility of a premature birth could be available in doctors’ offices in as little as five years.
9. Carbon Dioxide Catcher
Carbon dioxide catchers filter out CO₂ from the air and capture it for other uses. These include synthetic fuel creation, CO₂ for soft drinks, and plant growth in greenhouses.
10. New-wave Nuclear Power
Traditional nuclear reactors produce ~1,000 megawatts (MW), while these proposed mini-reactors would produce tens of megawatts ─ making them safer, more stable, and more financially viable for potential users.
A Vision for a Better Future
The biggest takeaway?
Seven of the 10 breakthrough technologies stem from the healthtech sector.
While several inventions on this list are years away from becoming a reality, they continue to embody the vision and passion that humans share to create and explore.
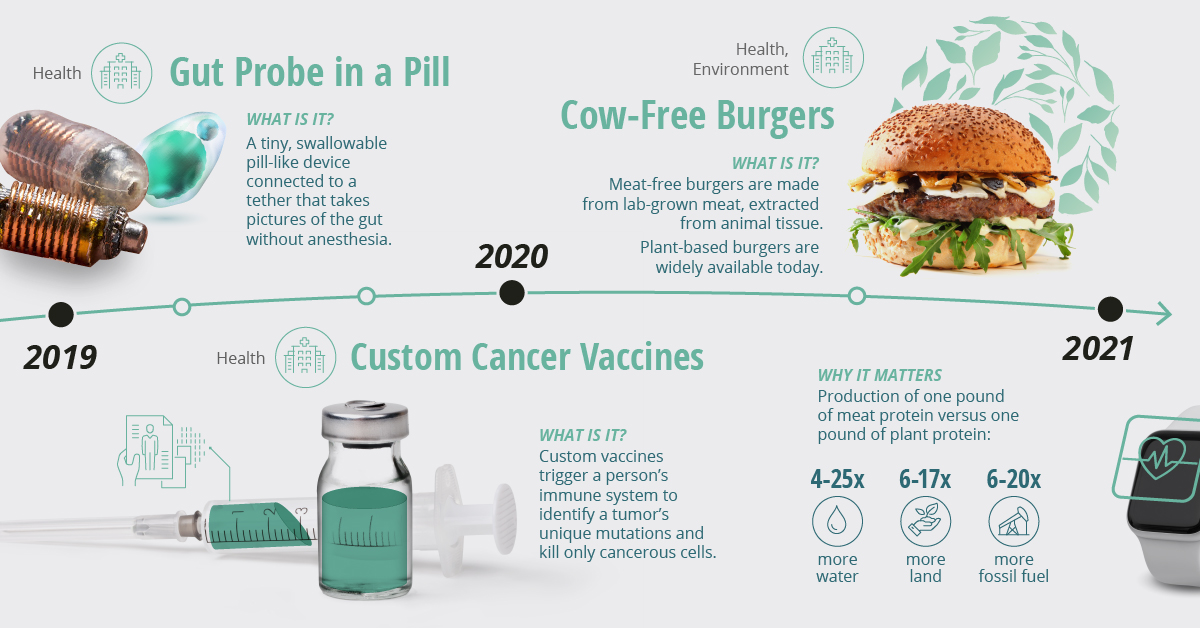


Chart of the Week
The Road to Recovery: Which Economies are Reopening?
We look at mobility rates as well as COVID-19 recovery rates for 41 economies, to see which countries are reopening for business.

The Road to Recovery: Which Economies are Reopening?
COVID-19 has brought the world to a halt—but after months of uncertainty, it seems that the situation is slowly taking a turn for the better.
Today’s chart measures the extent to which 41 major economies are reopening, by plotting two metrics for each country: the mobility rate and the COVID-19 recovery rate:
- Mobility Index
This refers to the change in activity around workplaces, subtracting activity around residences, measured as a percentage deviation from the baseline. - COVID-19 Recovery Rate
The number of recovered cases in a country is measured as the percentage of total cases.
Data for the first measure comes from Google’s COVID-19 Community Mobility Reports, which relies on aggregated, anonymous location history data from individuals. Note that China does not show up in the graphic as the government bans Google services.
COVID-19 recovery rates rely on values from CoronaTracker, using aggregated information from multiple global and governmental databases such as WHO and CDC.
Reopening Economies, One Step at a Time
In general, the higher the mobility rate, the more economic activity this signifies. In most cases, mobility rate also correlates with a higher rate of recovered people in the population.
Here’s how these countries fare based on the above metrics.
| Country | Mobility Rate | Recovery Rate | Total Cases | Total Recovered |
|---|---|---|---|---|
| Argentina | -56% | 31.40% | 14,702 | 4,617 |
| Australia | -41% | 92.03% | 7,150 | 6,580 |
| Austria | -100% | 91.93% | 16,628 | 15,286 |
| Belgium | -105% | 26.92% | 57,849 | 15,572 |
| Brazil | -48% | 44.02% | 438,812 | 193,181 |
| Canada | -67% | 52.91% | 88,512 | 46,831 |
| Chile | -110% | 41.58% | 86,943 | 36,150 |
| Colombia | -73% | 26.28% | 25,366 | 6,665 |
| Czechia | -29% | 70.68% | 9,140 | 6,460 |
| Denmark | -93% | 88.43% | 11,512 | 10,180 |
| Finland | -93% | 81.57% | 6,743 | 5,500 |
| France | -100% | 36.08% | 186,238 | 67,191 |
| Germany | -99% | 89.45% | 182,452 | 163,200 |
| Greece | -32% | 47.28% | 2,906 | 1,374 |
| Hong Kong | -10% | 97.00% | 1,067 | 1,035 |
| Hungary | -49% | 52.31% | 3,816 | 1,996 |
| India | -65% | 42.88% | 165,386 | 70,920 |
| Indonesia | -77% | 25.43% | 24,538 | 6,240 |
| Ireland | -79% | 88.92% | 24,841 | 22,089 |
| Israel | -31% | 87.00% | 16,872 | 14,679 |
| Italy | -52% | 64.99% | 231,732 | 150,604 |
| Japan | -33% | 84.80% | 16,683 | 14,147 |
| Malaysia | -53% | 80.86% | 7,629 | 6,169 |
| Mexico | -69% | 69.70% | 78,023 | 54,383 |
| Netherlands | -97% | 0.01% | 45,950 | 3 |
| New Zealand | -21% | 98.01% | 1,504 | 1,474 |
| Norway | -100% | 91.87% | 8,411 | 7,727 |
| Philippines | -87% | 23.08% | 15,588 | 3,598 |
| Poland | -36% | 46.27% | 22,825 | 10,560 |
| Portugal | -65% | 58.99% | 31,596 | 18,637 |
| Singapore | -105% | 55.02% | 33,249 | 18,294 |
| South Africa | -74% | 52.44% | 27,403 | 14,370 |
| South Korea | -4% | 91.15% | 11,344 | 10,340 |
| Spain | -67% | 69.11% | 284,986 | 196,958 |
| Sweden | -93% | 13.91% | 35,727 | 4,971 |
| Switzerland | -101% | 91.90% | 30,796 | 28,300 |
| Taiwan | 4% | 95.24% | 441 | 420 |
| Thailand | -36% | 96.08% | 3,065 | 2,945 |
| U.S. | -56% | 28.20% | 1,768,346 | 498,720 |
| United Kingdom | -82% | 0.05% | 269,127 | 135 |
| Vietnam | 15% | 85.02% | 327 | 278 |
Mobility data as of May 21, 2020 (Latest available). COVID-19 case data as of May 29, 2020.
In the main scatterplot visualization, we’ve taken things a step further, assigning these countries into four distinct quadrants:
1. High Mobility, High Recovery
High recovery rates are resulting in lifted restrictions for countries in this quadrant, and people are steadily returning to work.
New Zealand has earned praise for its early and effective pandemic response, allowing it to curtail the total number of cases. This has resulted in a 98% recovery rate, the highest of all countries. After almost 50 days of lockdown, the government is recommending a flexible four-day work week to boost the economy back up.
2. High Mobility, Low Recovery
Despite low COVID-19 related recoveries, mobility rates of countries in this quadrant remain higher than average. Some countries have loosened lockdown measures, while others did not have strict measures in place to begin with.
Brazil is an interesting case study to consider here. After deferring lockdown decisions to state and local levels, the country is now averaging the highest number of daily cases out of any country. On May 28th, for example, the country had 24,151 new cases and 1,067 new deaths.
3. Low Mobility, High Recovery
Countries in this quadrant are playing it safe, and holding off on reopening their economies until the population has fully recovered.
Italy, the once-epicenter for the crisis in Europe is understandably wary of cases rising back up to critical levels. As a result, it has opted to keep its activity to a minimum to try and boost the 65% recovery rate, even as it slowly emerges from over 10 weeks of lockdown.
4. Low Mobility, Low Recovery
Last but not least, people in these countries are cautiously remaining indoors as their governments continue to work on crisis response.
With a low 0.05% recovery rate, the United Kingdom has no immediate plans to reopen. A two-week lag time in reporting discharged patients from NHS services may also be contributing to this low number. Although new cases are leveling off, the country has the highest coronavirus-caused death toll across Europe.
The U.S. also sits in this quadrant with over 1.7 million cases and counting. Recently, some states have opted to ease restrictions on social and business activity, which could potentially result in case numbers climbing back up.
Over in Sweden, a controversial herd immunity strategy meant that the country continued business as usual amid the rest of Europe’s heightened regulations. Sweden’s COVID-19 recovery rate sits at only 13.9%, and the country’s -93% mobility rate implies that people have been taking their own precautions.
COVID-19’s Impact on the Future
It’s important to note that a “second wave” of new cases could upend plans to reopen economies. As countries reckon with these competing risks of health and economic activity, there is no clear answer around the right path to take.
COVID-19 is a catalyst for an entirely different future, but interestingly, it’s one that has been in the works for a while.
Without being melodramatic, COVID-19 is like the last nail in the coffin of globalization…The 2008-2009 crisis gave globalization a big hit, as did Brexit, as did the U.S.-China trade war, but COVID is taking it to a new level.
—Carmen Reinhart, incoming Chief Economist for the World Bank
Will there be any chance of returning to “normal” as we know it?

-

 Education1 week ago
How Hard Is It to Get Into an Ivy League School?
-

 Technology2 weeks ago
Ranked: Semiconductor Companies by Industry Revenue Share
-

 Markets2 weeks ago
Ranked: The World’s Top Flight Routes, by Revenue
-

 Demographics2 weeks ago
Population Projections: The World’s 6 Largest Countries in 2075
-

 Markets2 weeks ago
The Top 10 States by Real GDP Growth in 2023
-

 Demographics2 weeks ago
The Smallest Gender Wage Gaps in OECD Countries
-

 Economy2 weeks ago
Where U.S. Inflation Hit the Hardest in March 2024
-

 Environment2 weeks ago
Top Countries By Forest Growth Since 2001