Mining
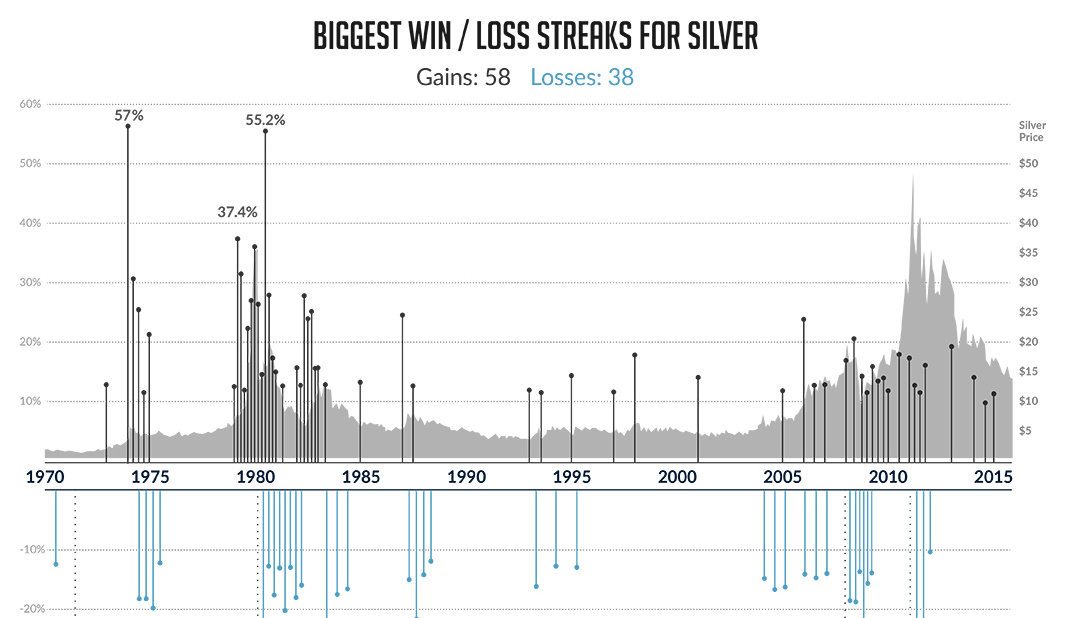
Silver’s Biggest Winning and Losing Streaks
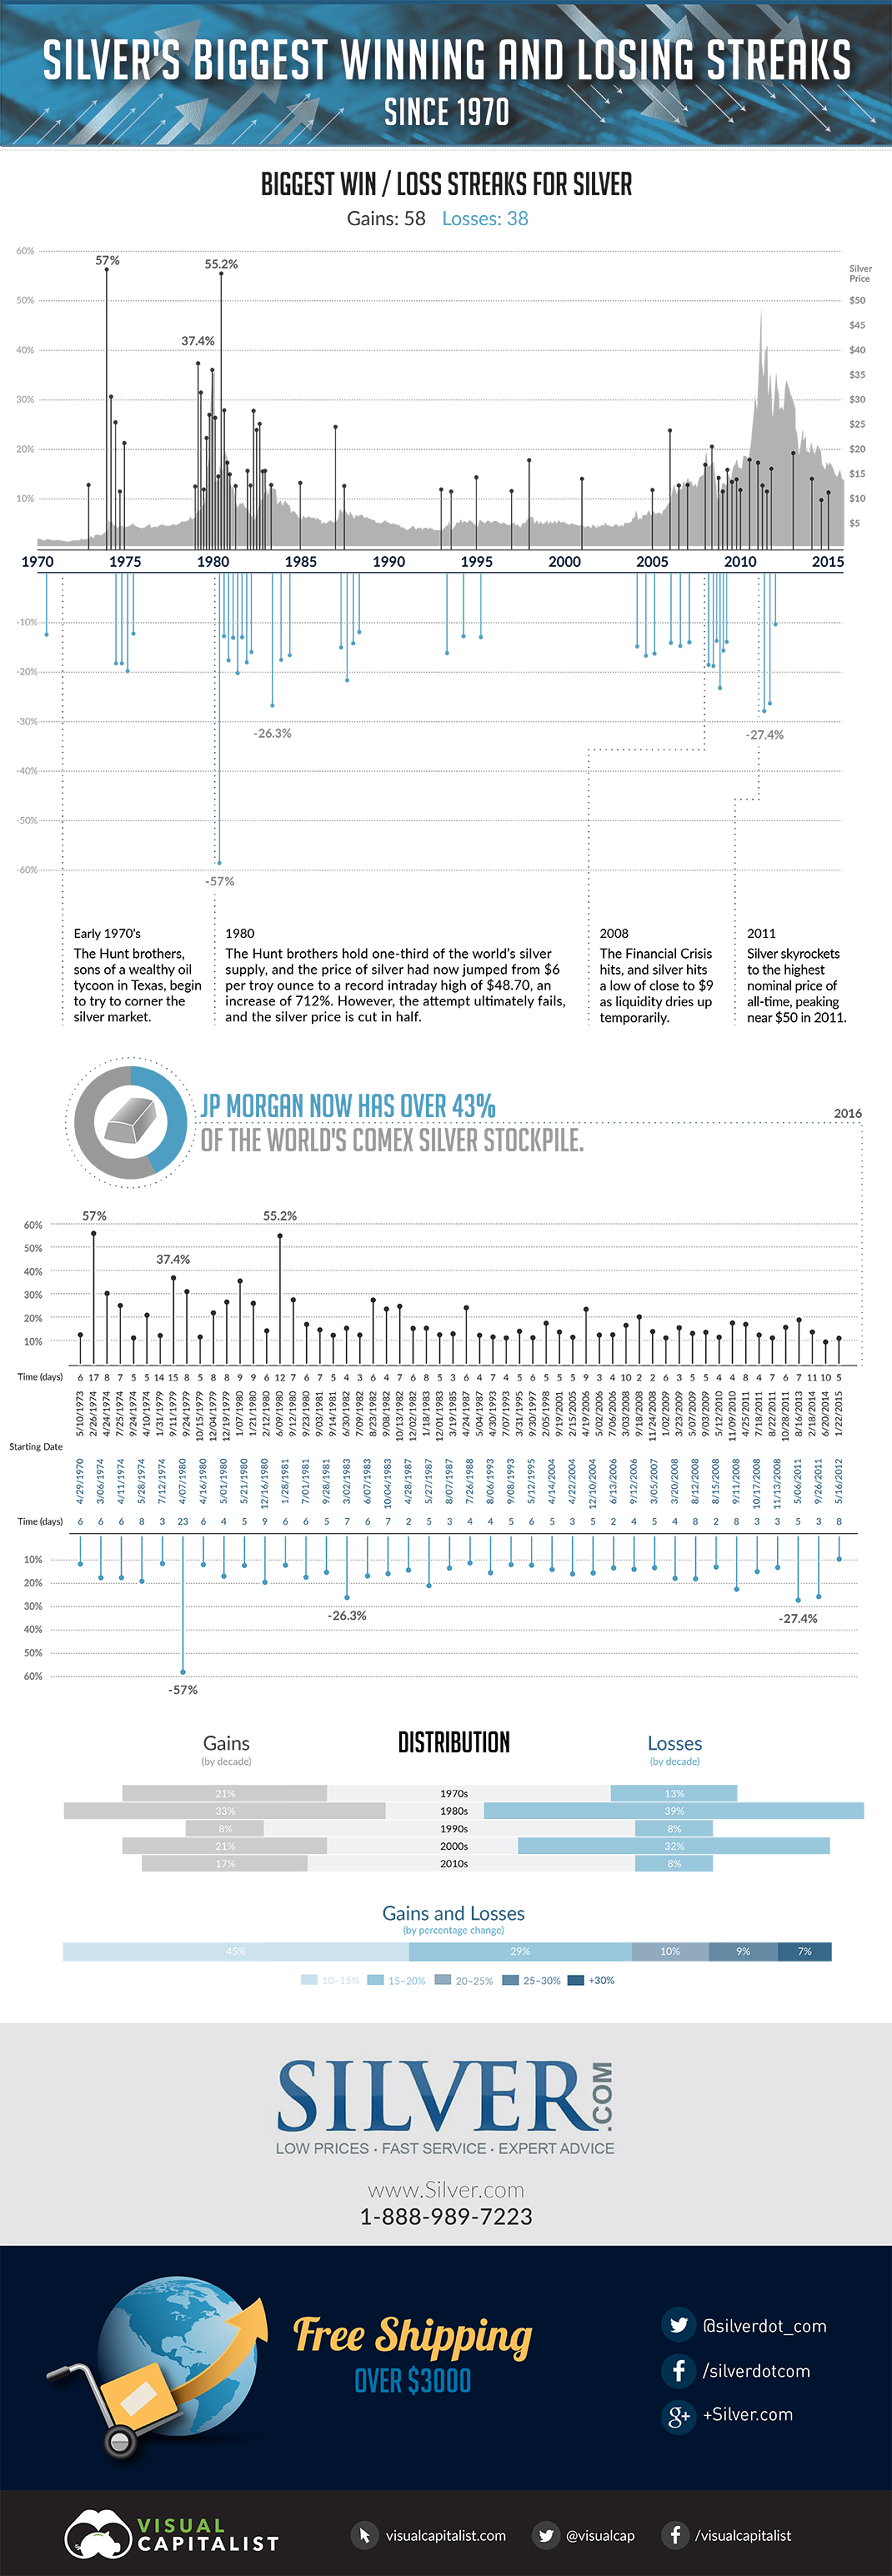
Silver’s Biggest Winning and Losing Streaks
With global markets getting off to one of their most volatile starts in history, precious metals have benefited tremendously.
Gold started 2016 on a torrid pace, as investors scrambled to buy physical gold as well as record-amounts of gold ETFs. A quick glance at the year’s best-performing commodities has gold at the top, beating almost everything (except lumber) in dollar terms so far.
Silver, which tends to closely follow gold, has been on a slightly less-skyward ascent.
The gold/silver ratio now sits at 80, which it hasn’t reached for an extended period of time since the early 1990s. This could mean that silver is undervalued, and silver has shown over time that it can jump up in price with sudden, strong movements.
Today’s infographic, which covers silver’s biggest win and loss streaks since 1970, really helps to show the magnitude of this volatility. In fact, silver has gone on 58 such runs where it jumped more than 10% in price in a mere matter of days – compare this to gold, which has only had 31 such streaks.
Silver’s Three Biggest Runs
Silver’s three biggest win streaks all tie into the Hunt Brothers’ cornering of the silver market.
+57.0% in 1974: Silver’s biggest winning streak happened in February 1974, around the time the Hunts began accumulating silver. They were worried about the effect of high inflation on their fortunes, and saw silver as a means to combat a potential loss of buying power.
+37.4% in 1979: As the Hunt Brothers became closer to cornering the market, there were four separate silver runs all over +30% that occurred within 12 months. This was the first one, happening in September 1979.
+55.2% in 1980: This was an eventful time for silver. First, there was Silver Thursday and the Hunts’ margin-call crash, in which the metal would subsequently plummet for its longest-ever losing streak of -57% over 23 days. Then, silver would bounce back in June with its second-biggest winning streak of all-time with a +55.2% stretch over 12 days.
While the most extreme silver price movements can be traced back to the Hunt era, it has still had many big movements in modern times. About 38% of silver’s biggest win streaks (and 40% of its notable losing streaks) have happened since 2000.


Lithium
Ranked: The Top 10 EV Battery Manufacturers in 2023
Asia dominates this ranking of the world’s largest EV battery manufacturers in 2023.


The Top 10 EV Battery Manufacturers in 2023
This was originally posted on our Voronoi app. Download the app for free on iOS or Android and discover incredible data-driven charts from a variety of trusted sources.
Despite efforts from the U.S. and EU to secure local domestic supply, all major EV battery manufacturers remain based in Asia.
In this graphic we rank the top 10 EV battery manufacturers by total battery deployment (measured in megawatt-hours) in 2023. The data is from EV Volumes.
Chinese Dominance
Contemporary Amperex Technology Co. Limited (CATL) has swiftly risen in less than a decade to claim the title of the largest global battery group.
The Chinese company now has a 34% share of the market and supplies batteries to a range of made-in-China vehicles, including the Tesla Model Y, SAIC’s MG4/Mulan, and various Li Auto models.
| Company | Country | 2023 Production (megawatt-hour) | Share of Total Production |
|---|---|---|---|
| CATL | 🇨🇳 China | 242,700 | 34% |
| BYD | 🇨🇳 China | 115,917 | 16% |
| LG Energy Solution | 🇰🇷 Korea | 108,487 | 15% |
| Panasonic | 🇯🇵 Japan | 56,560 | 8% |
| SK On | 🇰🇷 Korea | 40,711 | 6% |
| Samsung SDI | 🇰🇷 Korea | 35,703 | 5% |
| CALB | 🇨🇳 China | 23,493 | 3% |
| Farasis Energy | 🇨🇳 China | 16,527 | 2% |
| Envision AESC | 🇨🇳 China | 8,342 | 1% |
| Sunwoda | 🇨🇳 China | 6,979 | 1% |
| Other | - | 56,040 | 8% |
In 2023, BYD surpassed LG Energy Solution to claim second place. This was driven by demand from its own models and growth in third-party deals, including providing batteries for the made-in-Germany Tesla Model Y, Toyota bZ3, Changan UNI-V, Venucia V-Online, as well as several Haval and FAW models.
The top three battery makers (CATL, BYD, LG) collectively account for two-thirds (66%) of total battery deployment.
Once a leader in the EV battery business, Panasonic now holds the fourth position with an 8% market share, down from 9% last year. With its main client, Tesla, now sourcing batteries from multiple suppliers, the Japanese battery maker seems to be losing its competitive edge in the industry.
Overall, the global EV battery market size is projected to grow from $49 billion in 2022 to $98 billion by 2029, according to Fortune Business Insights.

-

 Mining1 week ago
Gold vs. S&P 500: Which Has Grown More Over Five Years?
-

 Markets2 weeks ago
Ranked: The Most Valuable Housing Markets in America
-

 Money2 weeks ago
Which States Have the Highest Minimum Wage in America?
-

 AI2 weeks ago
Ranked: Semiconductor Companies by Industry Revenue Share
-

 Markets2 weeks ago
Ranked: The World’s Top Flight Routes, by Revenue
-

 Countries2 weeks ago
Population Projections: The World’s 6 Largest Countries in 2075
-

 Markets2 weeks ago
The Top 10 States by Real GDP Growth in 2023
-

 Demographics2 weeks ago
The Smallest Gender Wage Gaps in OECD Countries