Mining
Investors Buy Gold ETFs at Record Pace [Chart]
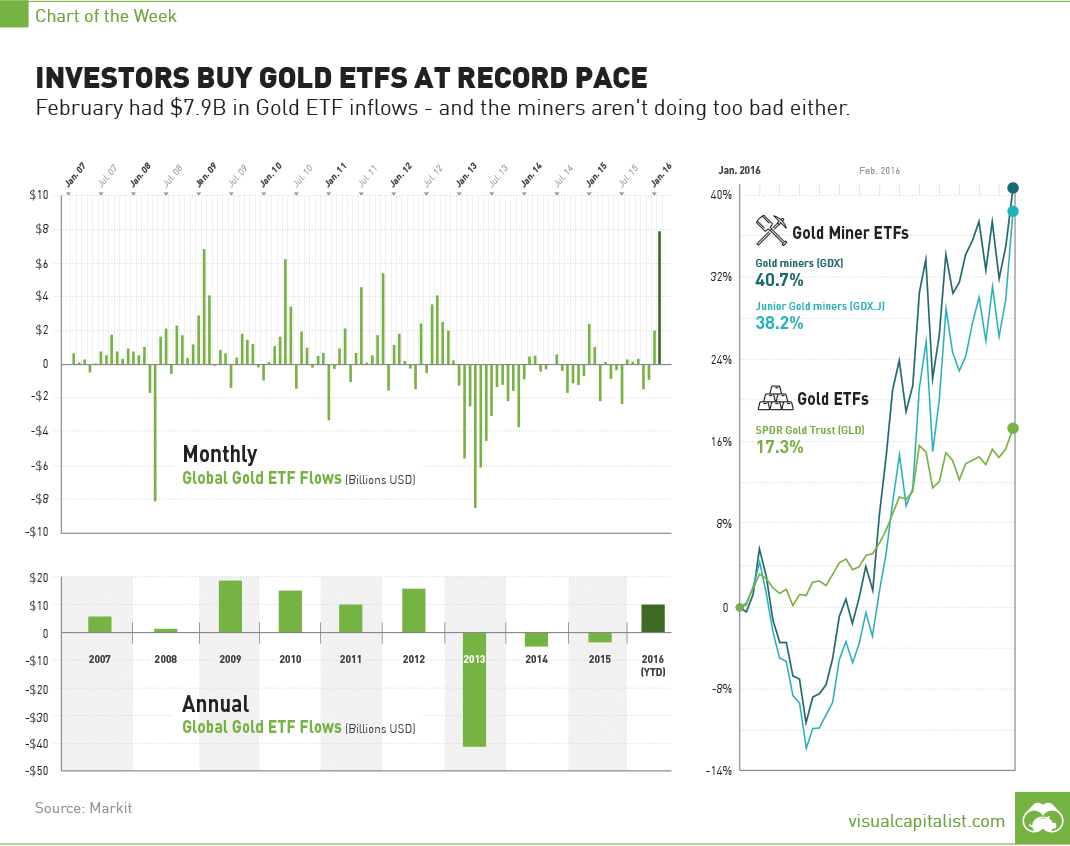
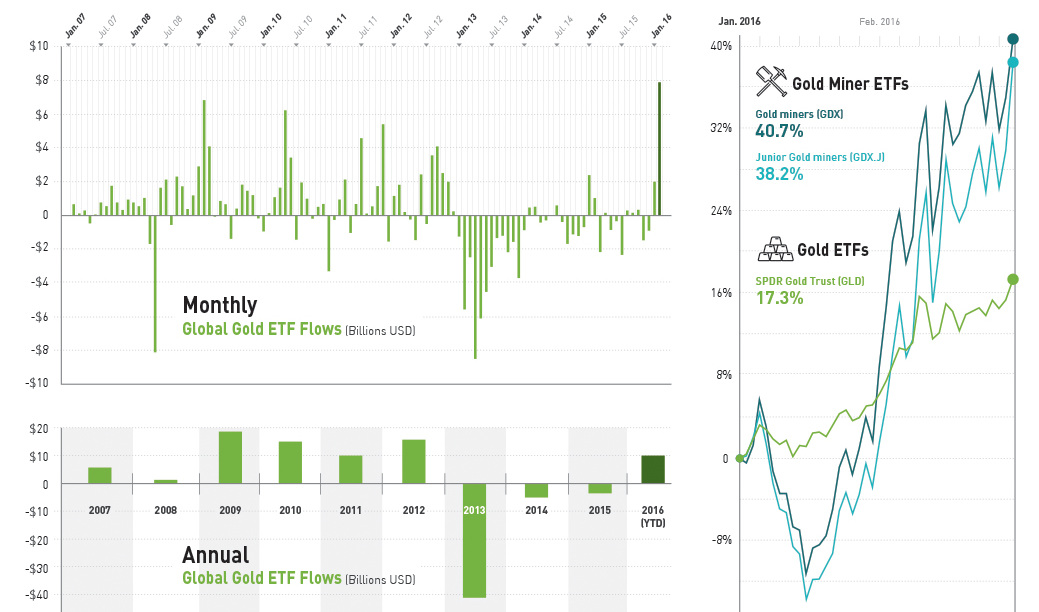
Investors Buy Gold ETFs at Record Pace
February had $7.9B in Gold ETF inflows – and the miners aren’t doing too bad either.
The Chart of the Week is a weekly Visual Capitalist feature on Fridays.
What were the three most popular investments over the last month?
If we’re judging by ETF inflows, the three areas that investors piled into were precious metals, government bonds, and low-volatility equities.
Notably, it was gold ETFs that set a new record with their highest monthly inflows in eight years, as investors bought $7.9 billion of securities in February. This is according to the latest from market data company Markit, that also noted that inflows relative to assets under management (AUM) were equally as impressive.
More specifically, last month’s buying represented an increase of 14.6% in terms of AUM. This is a level only surpassed once before during the heat of the Financial Crisis, when inflows relative to AUM hit 17.7% in February 2009.
Miners Get Some Love
Gold mining companies have also received some appreciation so far in 2016, with the Gold Miners (GDX) and Junior Gold Miners (GDXJ) benchmarks up 40.7% and 38.2% respectively YTD.
Despite outperforming gold so far on the year, the GDX hasn’t seen the same kind of inflows as the physical commodity. In fact, February saw $25 million of net outflows to the gold mining ETF.
This phenomenon isn’t uncommon in the gold sector, as the performance of the metal and the return on miners isn’t always congruent.
Here’s the latest GDX/Gold ratio, which essentially tracks the price of the major gold miners relative to the metal itself:
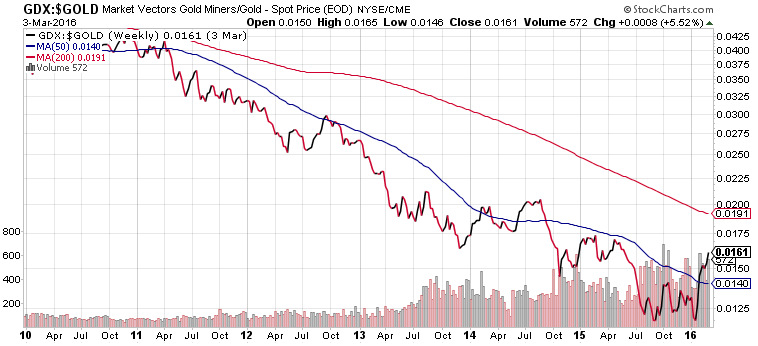
If the gold rally continues, there will be no shortage of opportunity for mining stock speculators. That’s why we gave you three reasons to consider gold in 2016 last month.


Lithium
Ranked: The Top 10 EV Battery Manufacturers in 2023
Asia dominates this ranking of the world’s largest EV battery manufacturers in 2023.


The Top 10 EV Battery Manufacturers in 2023
This was originally posted on our Voronoi app. Download the app for free on iOS or Android and discover incredible data-driven charts from a variety of trusted sources.
Despite efforts from the U.S. and EU to secure local domestic supply, all major EV battery manufacturers remain based in Asia.
In this graphic we rank the top 10 EV battery manufacturers by total battery deployment (measured in megawatt-hours) in 2023. The data is from EV Volumes.
Chinese Dominance
Contemporary Amperex Technology Co. Limited (CATL) has swiftly risen in less than a decade to claim the title of the largest global battery group.
The Chinese company now has a 34% share of the market and supplies batteries to a range of made-in-China vehicles, including the Tesla Model Y, SAIC’s MG4/Mulan, and various Li Auto models.
| Company | Country | 2023 Production (megawatt-hour) | Share of Total Production |
|---|---|---|---|
| CATL | 🇨🇳 China | 242,700 | 34% |
| BYD | 🇨🇳 China | 115,917 | 16% |
| LG Energy Solution | 🇰🇷 Korea | 108,487 | 15% |
| Panasonic | 🇯🇵 Japan | 56,560 | 8% |
| SK On | 🇰🇷 Korea | 40,711 | 6% |
| Samsung SDI | 🇰🇷 Korea | 35,703 | 5% |
| CALB | 🇨🇳 China | 23,493 | 3% |
| Farasis Energy | 🇨🇳 China | 16,527 | 2% |
| Envision AESC | 🇨🇳 China | 8,342 | 1% |
| Sunwoda | 🇨🇳 China | 6,979 | 1% |
| Other | - | 56,040 | 8% |
In 2023, BYD surpassed LG Energy Solution to claim second place. This was driven by demand from its own models and growth in third-party deals, including providing batteries for the made-in-Germany Tesla Model Y, Toyota bZ3, Changan UNI-V, Venucia V-Online, as well as several Haval and FAW models.
The top three battery makers (CATL, BYD, LG) collectively account for two-thirds (66%) of total battery deployment.
Once a leader in the EV battery business, Panasonic now holds the fourth position with an 8% market share, down from 9% last year. With its main client, Tesla, now sourcing batteries from multiple suppliers, the Japanese battery maker seems to be losing its competitive edge in the industry.
Overall, the global EV battery market size is projected to grow from $49 billion in 2022 to $98 billion by 2029, according to Fortune Business Insights.

-

 Mining1 week ago
Gold vs. S&P 500: Which Has Grown More Over Five Years?
-

 Markets2 weeks ago
Ranked: The Most Valuable Housing Markets in America
-

 Money2 weeks ago
Which States Have the Highest Minimum Wage in America?
-

 AI2 weeks ago
Ranked: Semiconductor Companies by Industry Revenue Share
-

 Markets2 weeks ago
Ranked: The World’s Top Flight Routes, by Revenue
-

 Countries2 weeks ago
Population Projections: The World’s 6 Largest Countries in 2075
-

 Markets2 weeks ago
The Top 10 States by Real GDP Growth in 2023
-

 Demographics2 weeks ago
The Smallest Gender Wage Gaps in OECD Countries