Mining
Three Major Reasons for Gold in 2016

Three Major Reasons for Gold in 2016
Presented by: Advantage Gold
This year looks to be another one of increased volatility as the market see-saws in different directions. Here are three compelling reasons why 2016 may be the perfect time to add gold to your portfolio.
1: “Stay the Course”
Financial experts often mention that “buying and holding” stocks through good and bad times is the best way to guarantee returns.
Investors that bought equities before the Financial Crisis have had a 20.2% return up until January 25, 2016. They “stayed the course” and were rewarded with an eventual return.
However, those that held gold during that same time period until today have had a 48.6% return, which is more than double that of the general market. This is even true with gold declining roughly 40% from its peak since late 2011.
Does it make more sense to “stay the course” in 2016 with stocks, or gold?
2: Two-Term Presidents
The last four presidents to serve two terms have had stock markets rise significantly during their tenures.
However, the stock markets also suffered catastrophic losses in each of their final years as president.
For example, during George W. Bush’s tenure, the S&P 500 nearly doubled from a bottom of 801 during the Dotcom bust to a peak of 1,562. Then the Financial Crisis hit at the end of Bush’s second term and the market went down to 677 points.
Obama is now in his last year, and the market is up 178% from its bottom in 2009. Will the trend continue?
3: Oil vs. Gold
Oil and gold have a relatively strong historical relationship. They are hard assets that move similarly in inflationary environments.
However, gold and oil also have some major differences in how supply and demand tends to affect the price.
Oil: Every day the world consumes 93 million barrels of oil. However, over the last two years there has been an excess of supply coupled with weakening demand from China and a slowing world economy. This has led to oil falling from over $100 per barrel to $30. Despite this glut, OPEC continues to produce record amounts of oil to maintain market share. Oil is delivered and consumed, and these fundamentals of supply and demand closely apply. More supply + weakening demand = lower prices.
Gold: Meanwhile, gold miner production is expected to peak in 2015 or 2016, and to decrease from there. Since gold is mostly traded via paper markets and not delivered, the nearly five-year low price point for gold may not fully reflect its supply and demand fundamentals. Gold discoveries are rarer than ever, and the cost and risks to mine are very high. Yet, this declining output is not yet seen in the gold price.
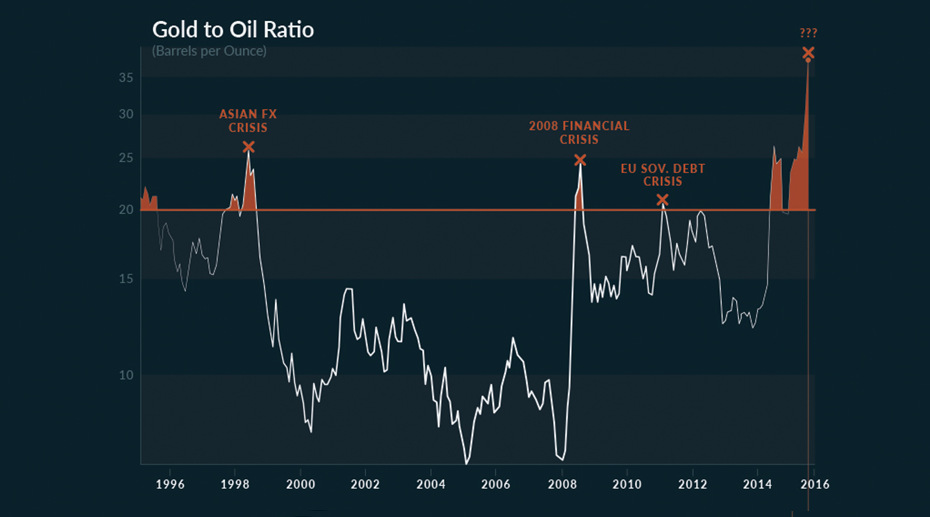
Gold to Oil Ratio
Lastly, the ratio between these two goods helps to explain what is going on in the world. Gold represents a safe haven during times of financial stress, and oil represents the overall health of the economy and industry.
The gold to oil ratio is expressed in the amount of oil barrels that can be bought with 1 oz of gold. A lower ratio means that the economy is doing well. Meanwhile, history shows that whenever the ratio is above 20, there has been some type of market crisis.
Today, this ratio is higher than ever in history at 37.
Would you rather own oil or gold?


Lithium
Ranked: The Top 10 EV Battery Manufacturers in 2023
Asia dominates this ranking of the world’s largest EV battery manufacturers in 2023.


The Top 10 EV Battery Manufacturers in 2023
This was originally posted on our Voronoi app. Download the app for free on iOS or Android and discover incredible data-driven charts from a variety of trusted sources.
Despite efforts from the U.S. and EU to secure local domestic supply, all major EV battery manufacturers remain based in Asia.
In this graphic we rank the top 10 EV battery manufacturers by total battery deployment (measured in megawatt-hours) in 2023. The data is from EV Volumes.
Chinese Dominance
Contemporary Amperex Technology Co. Limited (CATL) has swiftly risen in less than a decade to claim the title of the largest global battery group.
The Chinese company now has a 34% share of the market and supplies batteries to a range of made-in-China vehicles, including the Tesla Model Y, SAIC’s MG4/Mulan, and various Li Auto models.
| Company | Country | 2023 Production (megawatt-hour) | Share of Total Production |
|---|---|---|---|
| CATL | 🇨🇳 China | 242,700 | 34% |
| BYD | 🇨🇳 China | 115,917 | 16% |
| LG Energy Solution | 🇰🇷 Korea | 108,487 | 15% |
| Panasonic | 🇯🇵 Japan | 56,560 | 8% |
| SK On | 🇰🇷 Korea | 40,711 | 6% |
| Samsung SDI | 🇰🇷 Korea | 35,703 | 5% |
| CALB | 🇨🇳 China | 23,493 | 3% |
| Farasis Energy | 🇨🇳 China | 16,527 | 2% |
| Envision AESC | 🇨🇳 China | 8,342 | 1% |
| Sunwoda | 🇨🇳 China | 6,979 | 1% |
| Other | - | 56,040 | 8% |
In 2023, BYD surpassed LG Energy Solution to claim second place. This was driven by demand from its own models and growth in third-party deals, including providing batteries for the made-in-Germany Tesla Model Y, Toyota bZ3, Changan UNI-V, Venucia V-Online, as well as several Haval and FAW models.
The top three battery makers (CATL, BYD, LG) collectively account for two-thirds (66%) of total battery deployment.
Once a leader in the EV battery business, Panasonic now holds the fourth position with an 8% market share, down from 9% last year. With its main client, Tesla, now sourcing batteries from multiple suppliers, the Japanese battery maker seems to be losing its competitive edge in the industry.
Overall, the global EV battery market size is projected to grow from $49 billion in 2022 to $98 billion by 2029, according to Fortune Business Insights.

-

 Markets1 week ago
U.S. Debt Interest Payments Reach $1 Trillion
-

 Business2 weeks ago
Charted: Big Four Market Share by S&P 500 Audits
-

 Real Estate2 weeks ago
Ranked: The Most Valuable Housing Markets in America
-

 Money2 weeks ago
Which States Have the Highest Minimum Wage in America?
-

 AI2 weeks ago
Ranked: Semiconductor Companies by Industry Revenue Share
-

 Markets2 weeks ago
Ranked: The World’s Top Flight Routes, by Revenue
-

 Demographics2 weeks ago
Population Projections: The World’s 6 Largest Countries in 2075
-

 Markets2 weeks ago
The Top 10 States by Real GDP Growth in 2023