Precious Metals
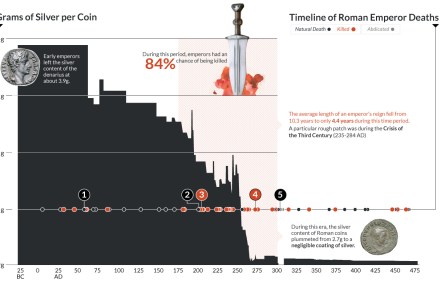
Chart: Deaths of Roman Emperors vs. Coinage Debasement
Presented by: 
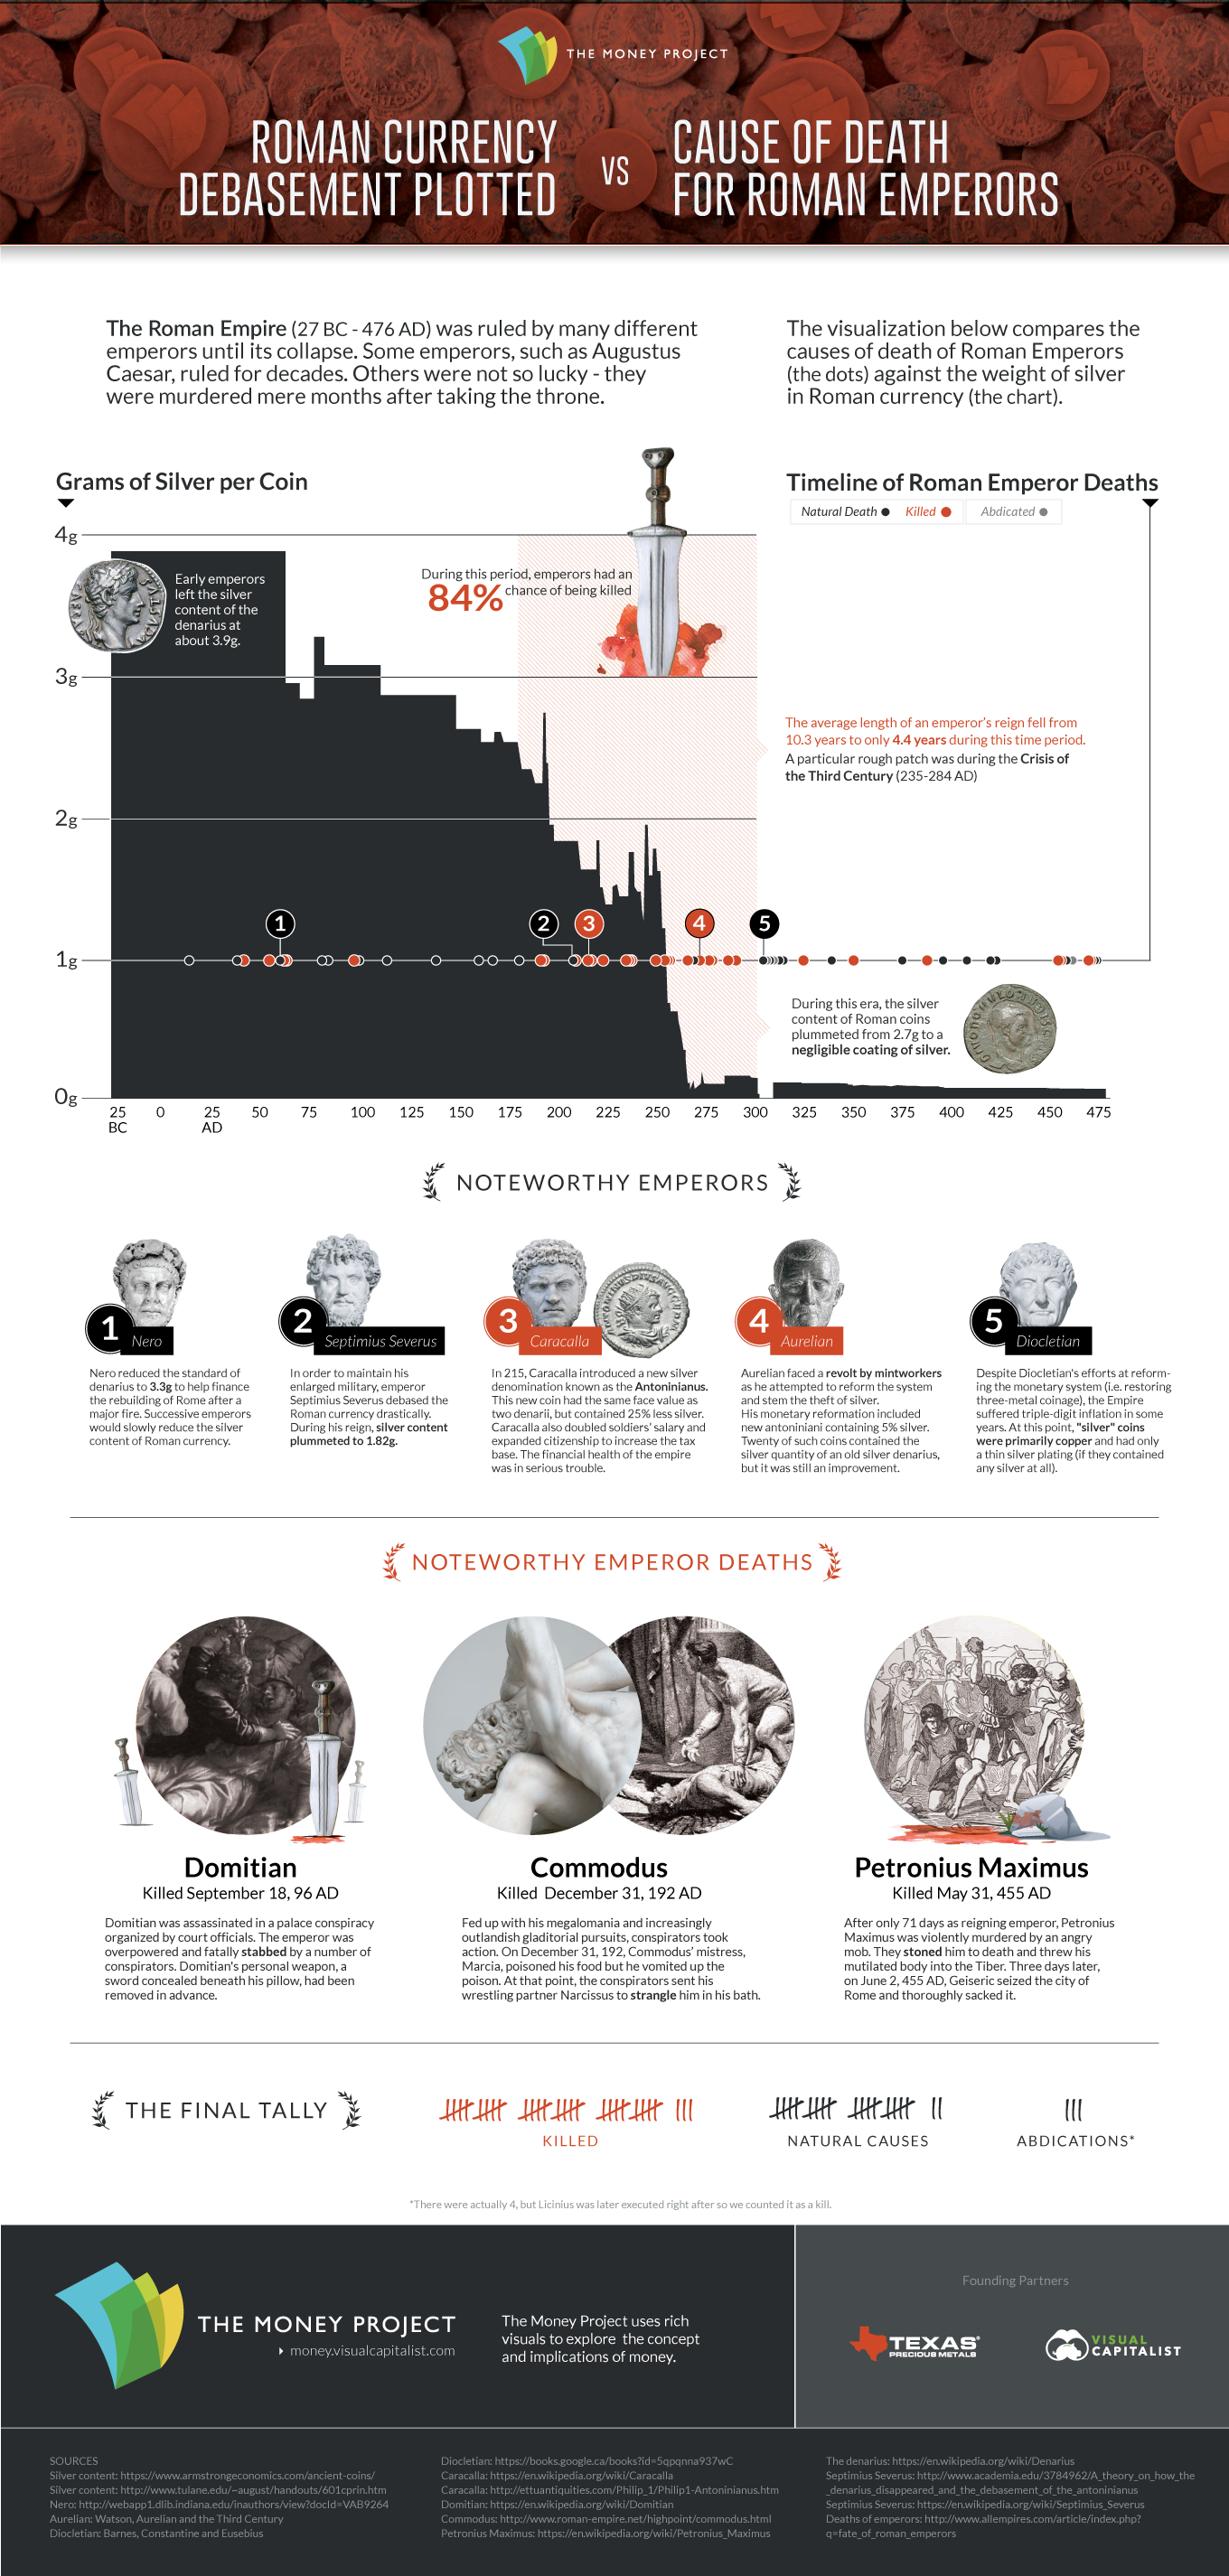
Chart: Deaths of Roman Emperors vs. Coinage Debasement
The Money Project is an ongoing collaboration between Visual Capitalist and Texas Precious Metals that seeks to use intuitive visualizations to explore the origins, nature, and use of money.
Correlation does not necessarily imply causation.
In other words, just because two sets of data may follow a similar pattern, it does not mean there is any direct causal relationship.
However, as we were assembling our previous research on Currency and the Collapse of the Roman Empire, we noticed something that was too uncanny to skip past: during the 113-year stretch of time from 192 to 305 AD, an astonishing amount of Roman emperors (84%) were either brutally murdered or assassinated.
This, of course, was a particularly troubled period for the Romans. During the Crisis of the Third Century (235 to 284 AD) specifically, the combined pressures of invasion, civil war, plague, and economic depression threatened to bring down the Empire.
Coincidentally, during this same time frame, the silver denarius went from having 2.7 grams silver to being “silver” in name only. Base metals such as bronze and copper were added to the silver coins to debase the currency, and by the year 300 AD, a silver denarius (or its equivalent) had only a trace of silver left.
Notes on the Data
Data on Roman Emperor deaths is from this resource, and the debasement of silver coinage was previously covered by Armstrong Economics.
Roman Emperor deaths or abdications included in the visualization are ones that occurred between the birth of the Empire (27 BC) to the fall of the Western Roman Empire (476 AD). It’s also worth noting that, according to the source, there is a significant amount of emperors who had fates that are unclear or died under mysterious circumstances, and therefore the list may not be entirely accurate.
About the Money Project
The Money Project aims to use intuitive visualizations to explore ideas around the very concept of money itself. Founded in 2015 by Visual Capitalist and Texas Precious Metals, the Money Project will look at the evolving nature of money, and will try to answer the difficult questions that prevent us from truly understanding the role that money plays in finance, investments, and accumulating wealth.


Mining
Visualizing the New Era of Gold Mining
This infographic highlights the need for new gold mining projects and shows the next generation of America’s gold deposits.
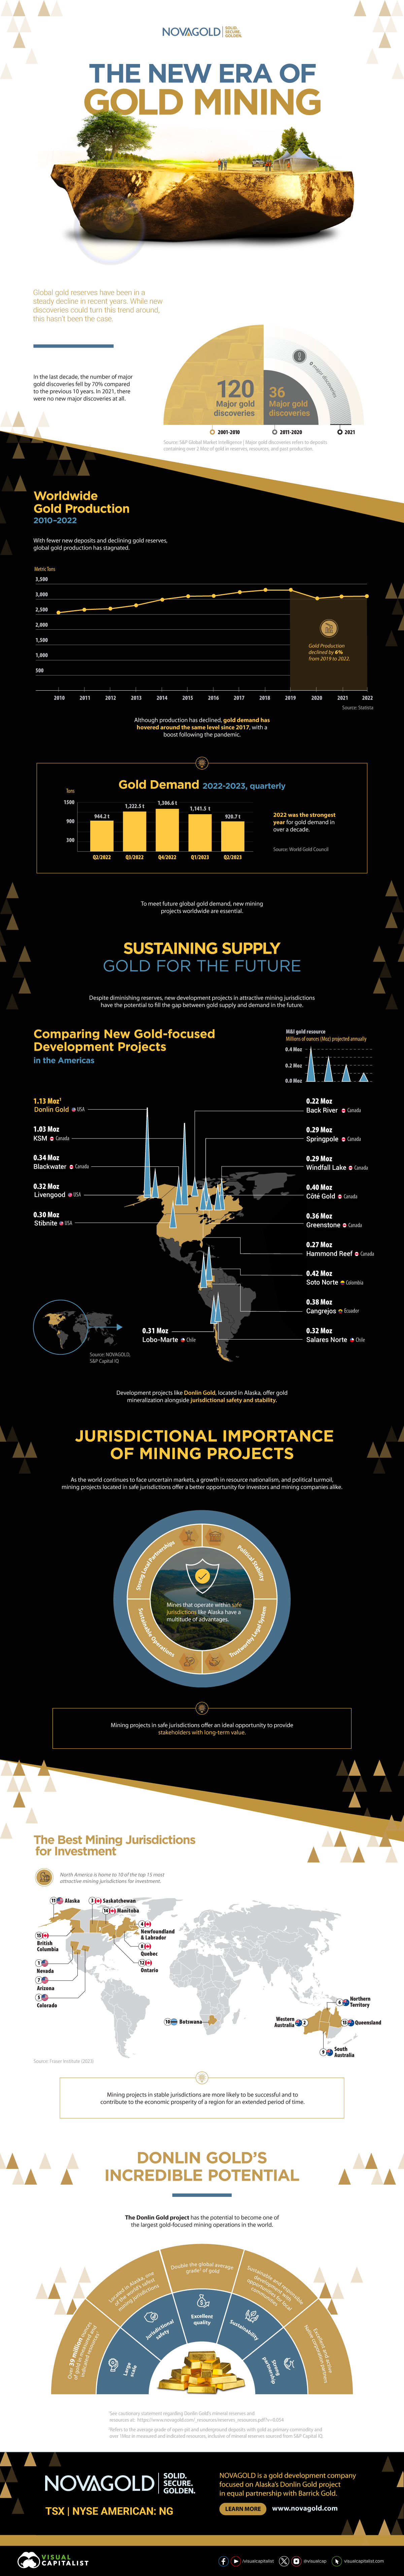
Visualizing the New Era of Gold Mining
Between 2011 and 2020, the number of major gold discoveries fell by 70% relative to 2001-2010.
The lack of discoveries, alongside stagnating gold production, has cast a shadow of doubt on the future of gold supply.
This infographic sponsored by NOVAGOLD highlights the need for new gold mining projects with a focus on the company’s Donlin Gold project in Alaska.
The Current State of Gold Production
Between 2010 and 2019, gold production increased steadily, though this growth has stagnated over the past few years.
| Year | Gold Production, tonnes | YoY % Change |
|---|---|---|
| 2010 | 2,560 | - |
| 2011 | 2,660 | 3.9% |
| 2012 | 2,690 | 1.1% |
| 2013 | 2,800 | 4.1% |
| 2014 | 2,990 | 6.8% |
| 2015 | 3,100 | 3.7% |
| 2016 | 3,110 | 0.3% |
| 2017 | 3,230 | 3.9% |
| 2018 | 3,300 | 2.2% |
| 2019 | 3,300 | 0.0% |
| 2020 | 3,030 | -8.2% |
| 2021 | 3,090 | 2.0% |
| 2022 | 3,100 | 0.3% |
Along with a small decrease in gold production in 2020, there were no new major gold discoveries in 2021.
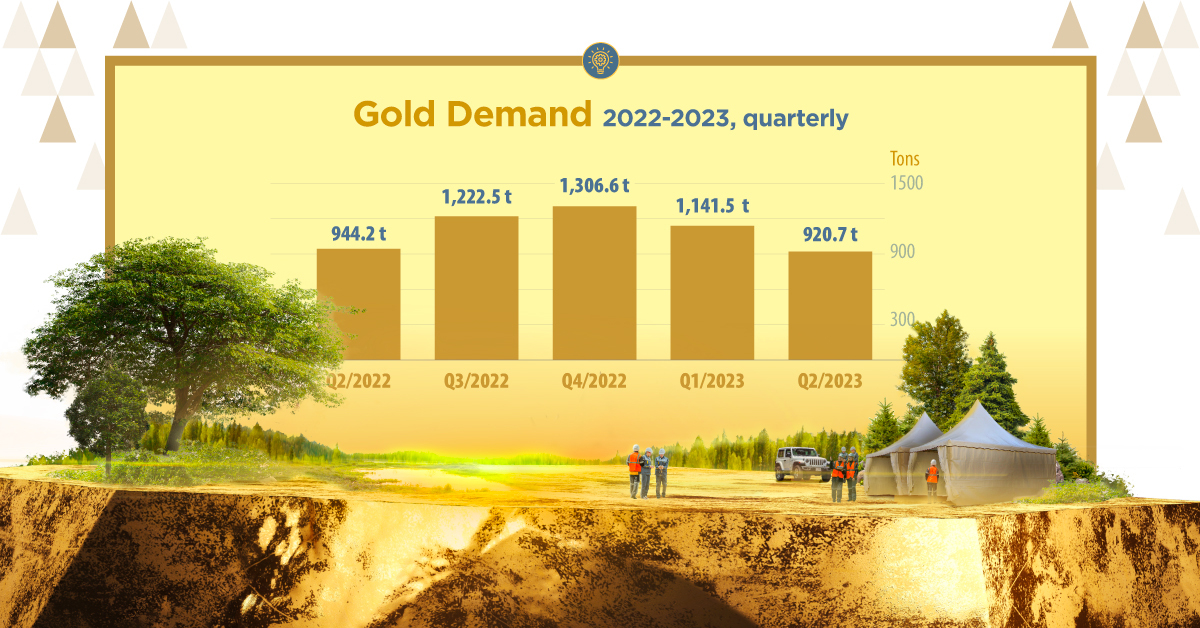
The fall in production and long-term lack of gold discoveries point towards a possible imbalance in gold supply and demand. This calls for the introduction of new gold development projects that can fill the supply-demand gap in the future.
Sustaining Supply: Gold for the Future
Jurisdictions play an important role when looking for projects that could sustain gold production well into the future.
From political stability to trustworthy legal systems, the characteristics of a jurisdiction can make or break mining projects. Amid ongoing market uncertainty, political turmoil, and resource nationalism, projects in safe jurisdictions offer a better investment opportunity for investors and mining companies.
Today, 10 of the top 15 mining jurisdictions for investment are located in North America, according to the Fraser Institute report published in 2023.
A Golden Opportunity
Located in Alaska, one of the world’s safest mining jurisdictions, NOVAGOLD’s 50% owned Donlin Gold project has the highest average grade of gold among major development projects in the Americas. For every tonne of ore, Donlin Gold offers 2.24 grams of gold, which is more than twice the global average grade of 1.04g/t.
Additionally, Donlin Gold is the second-largest gold-focused development project in the Americas, with over 39 million ounces of gold in M&I resources inclusive of reserves.
NOVAGOLD is focused on the Donlin Gold project in equal partnership with Barrick Gold.
Learn more about Donlin Gold .

-

 Mining4 days ago
Gold vs. S&P 500: Which Has Grown More Over Five Years?
The price of gold has set record highs in 2024, but how has this precious metal performed relative to the S&P 500?
-

 Mining2 weeks ago
Charted: The Value Gap Between the Gold Price and Gold Miners
While the price of gold has reached new record highs in 2024, gold mining stocks are still far from their 2011 peaks.
-

 Uranium2 months ago
Charted: Global Uranium Reserves, by Country
We visualize the distribution of the world’s uranium reserves by country, with 3 countries accounting for more than half of total reserves.
-

 Markets3 months ago
The Periodic Table of Commodity Returns (2014-2023)
Commodity returns in 2023 took a hit. This graphic shows the performance of commodities like gold, oil, nickel, and corn over the last decade.
-

 Strategic Metals3 months ago
China Dominates the Supply of U.S. Critical Minerals List
The U.S. Geological Survey estimates that in 2022, China was the world’s leading producer of 30 out of 50 entries on the U.S. critical minerals list.
-

 Mining5 months ago
The Critical Minerals to China, EU, and U.S. National Security
Ten materials, including cobalt, lithium, graphite, and rare earths, are deemed critical by all three.


-

 Green2 weeks ago
Ranked: Top Countries by Total Forest Loss Since 2001
-

 Travel2 weeks ago
Ranked: The World’s Top Flight Routes, by Revenue
-

 Technology2 weeks ago
Ranked: Semiconductor Companies by Industry Revenue Share
-

 Money2 weeks ago
Which States Have the Highest Minimum Wage in America?
-

 Real Estate2 weeks ago
Ranked: The Most Valuable Housing Markets in America
-

 Markets2 weeks ago
Charted: Big Four Market Share by S&P 500 Audits
-

 AI2 weeks ago
The Stock Performance of U.S. Chipmakers So Far in 2024
-

 Automotive2 weeks ago
Almost Every EV Stock is Down After Q1 2024