Mining
Gold’s Biggest Winning and Losing Streaks
Gold’s Biggest Winning and Losing Streaks
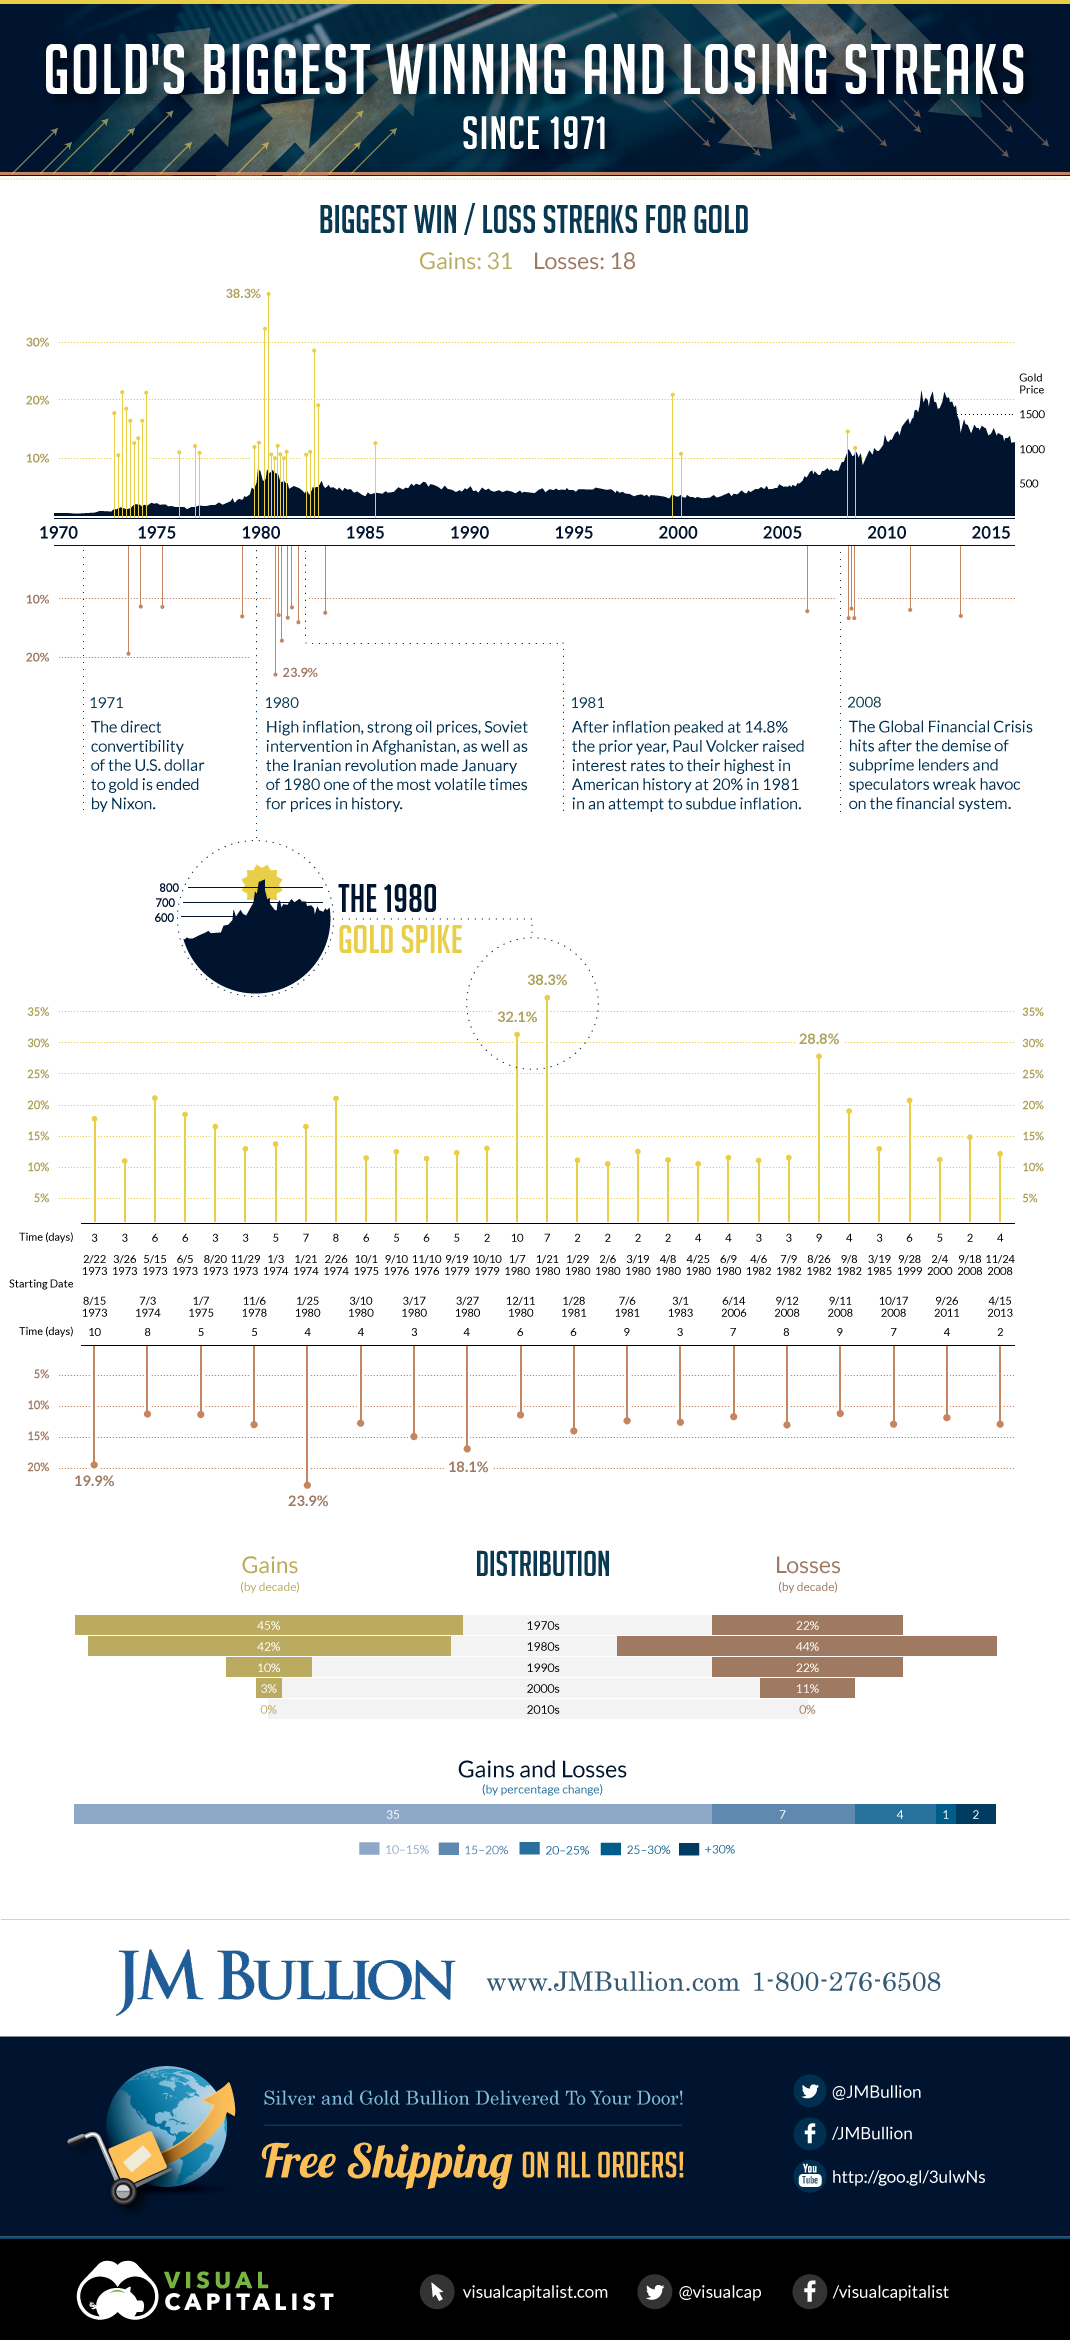
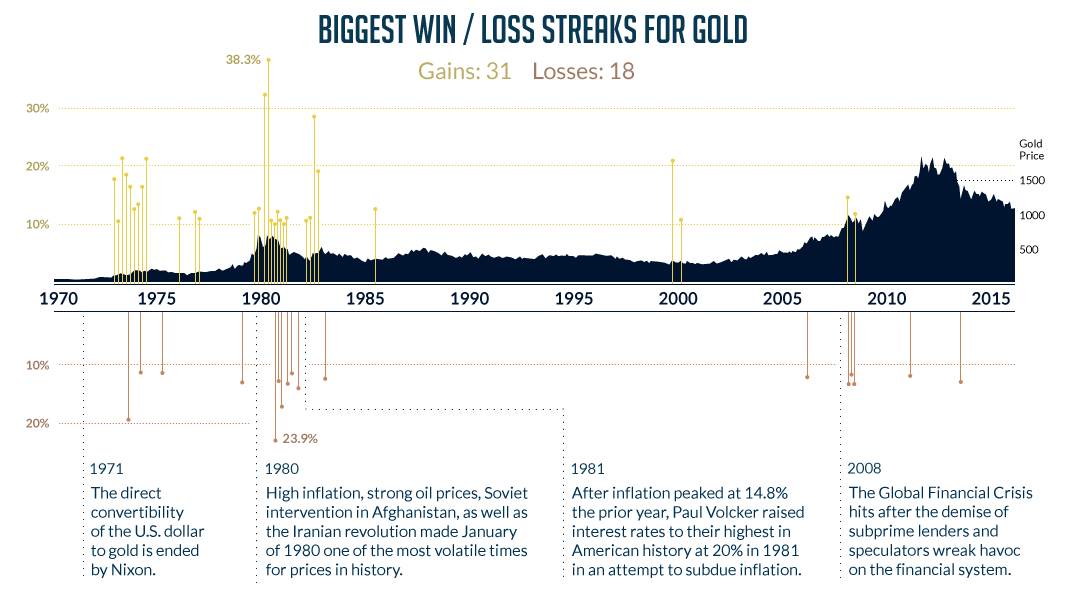
Gold has started 2016 in “hot” territory. Up 5% in just under a month, the yellow metal is one of the only bright spot shining in a sea of market volatility.
However, a 5% rise over the course of a month is nothing for gold. Since it began trading freely in 1971, the metal has had dozens of glittering hot streaks that make the start of 2016 look boring in comparison. On the flipside, gold has also had many cold streaks that saw it lose hundreds of dollars of value in just a matter of days.
Today’s infographic covers gold’s longest winning and losing streaks. The streaks listed include all runs, positive or negative, over 10%.
There have been 31 positive runs over 10%, and 18 losing streaks over the same threshold.
Interestingly, all of these streaks have occurred in previous decades. Since 2010, we have not seen one winning or losing streak of a similar magnitude.
The most volatile decade for gold was the early 1980s, when record-high interest rates, the Iranian Revolution, high oil prices and recessionary forces reigned supreme. Nearly half of all of gold’s biggest wins and losses (between 1971 and today) were during this wild decade.


Mining
Charted: The Value Gap Between the Gold Price and Gold Miners
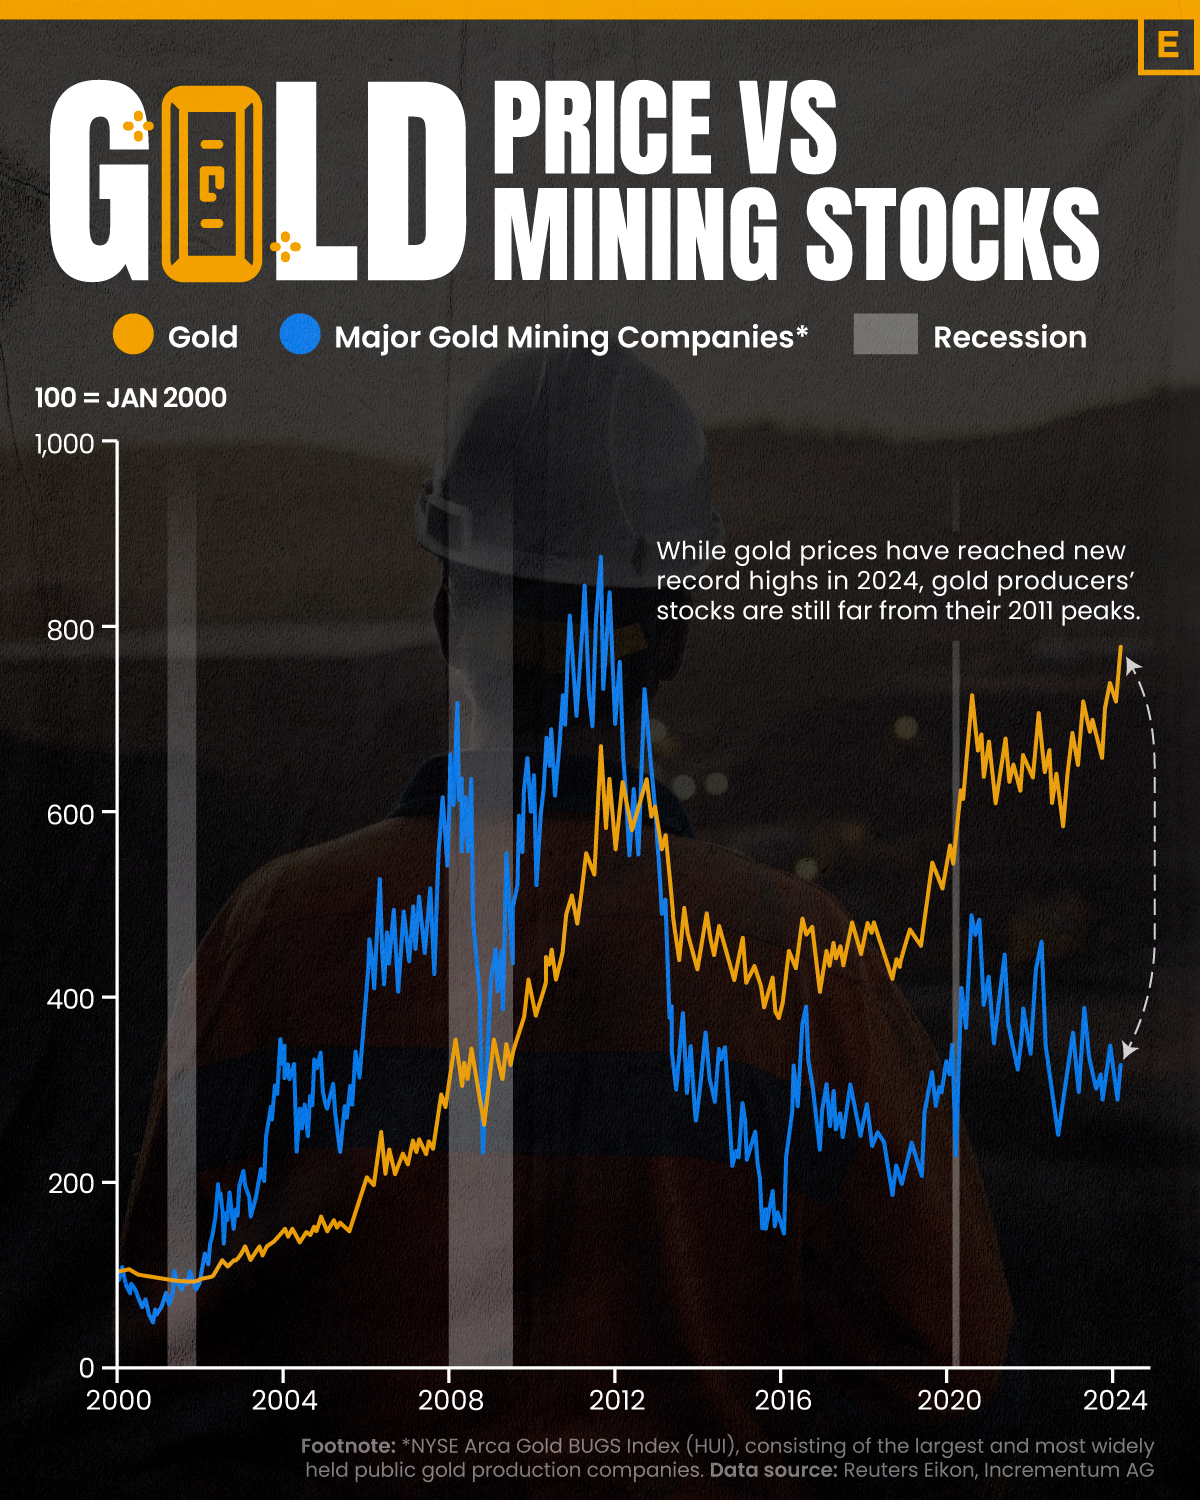
While the price of gold has reached new record highs in 2024, gold mining stocks are still far from their 2011 peaks.
The Value Gap Between the Gold Price and Gold Miners
This was originally posted on our Voronoi app. Download the app for free on Apple or Android and discover incredible data-driven charts from a variety of trusted sources.
Although the price of gold has reached new record highs in 2024, gold miners are still far from their 2011 peaks.
In this graphic, we illustrate the evolution of gold prices since 2000 compared to the NYSE Arca Gold BUGS Index (HUI), which consists of the largest and most widely held public gold production companies. The data was compiled by Incrementum AG.
Mining Stocks Lag Far Behind
In April 2024, gold reached a new record high as Federal Reserve Chair Jerome Powell signaled policymakers may delay interest rate cuts until clearer signs of declining inflation materialize.
Additionally, with elections occurring in more than 60 countries in 2024 and ongoing conflicts in Ukraine and Gaza, central banks are continuing to buy gold to strengthen their reserves, creating momentum for the metal.
Traditionally known as a hedge against inflation and a safe haven during times of political and economic uncertainty, gold has climbed over 11% so far this year.
According to Business Insider, gold miners experienced their best performance in a year in March 2024. During that month, the gold mining sector outperformed all other U.S. industries, surpassing even the performance of semiconductor stocks.
Still, physical gold has outperformed shares of gold-mining companies over the past three years by one of the largest margins in decades.
| Year | Gold Price | NYSE Arca Gold BUGS Index (HUI) |
|---|---|---|
| 2023 | $2,062.92 | $243.31 |
| 2022 | $1,824.32 | $229.75 |
| 2021 | $1,828.60 | $258.87 |
| 2020 | $1,895.10 | $299.64 |
| 2019 | $1,523.00 | $241.94 |
| 2018 | $1,281.65 | $160.58 |
| 2017 | $1,296.50 | $192.31 |
| 2016 | $1,151.70 | $182.31 |
| 2015 | $1,060.20 | $111.18 |
| 2014 | $1,199.25 | $164.03 |
| 2013 | $1,201.50 | $197.70 |
| 2012 | $1,664.00 | $444.22 |
| 2011 | $1,574.50 | $498.73 |
| 2010 | $1,410.25 | $573.32 |
| 2009 | $1,104.00 | $429.91 |
| 2008 | $865.00 | $302.41 |
| 2007 | $836.50 | $409.37 |
| 2006 | $635.70 | $338.24 |
| 2005 | $513.00 | $276.90 |
| 2004 | $438.00 | $215.33 |
| 2003 | $417.25 | $242.93 |
| 2002 | $342.75 | $145.12 |
| 2001 | $276.50 | $65.20 |
| 2000 | $272.65 | $40.97 |
Among the largest companies on the NYSE Arca Gold BUGS Index, Colorado-based Newmont has experienced a 24% drop in its share price over the past year. Similarly, Canadian Barrick Gold also saw a decline of 6.5% over the past 12 months.

-
 Money2 weeks ago
Visualizing the Growth of $100, by Asset Class (1970-2023)
-

 Money1 week ago
Where Does One U.S. Tax Dollar Go?
-

 Green2 weeks ago
Ranked: Top Countries by Total Forest Loss Since 2001
-

 Real Estate2 weeks ago
Visualizing America’s Shortage of Affordable Homes
-

 Maps2 weeks ago
Mapped: Average Wages Across Europe
-

 Mining2 weeks ago
Charted: The Value Gap Between the Gold Price and Gold Miners
-

 Demographics2 weeks ago
Visualizing the Size of the Global Senior Population
-

 Automotive2 weeks ago
Tesla Is Once Again the World’s Best-Selling EV Company