Markets
Everything You Need to Know About Recessions


Everything You Need to Know About Recessions
Just like in life, markets go through peaks and valleys. The good news for investors is that often the peaks ascend to far greater heights than the depths of the valleys.
Today’s post helps to put recessions into perspective. It draws information from Capital Group to break down the frequency of economic expansions and recessions in modern U.S. history, while also showing their typical impact.
What is a Recession?
Not all recessions are the same. Some can last long while others are short. Some create lasting effects, while others are quickly forgotten. Some cripple entire economies, while others are much more targeted, impacting specific sectors within the economy.
Recession is when your neighbor loses their job. Depression is when you lose yours.
– Harry Truman
According to the National Bureau of Economic Research, a recession can be described as a significant decline in economic activity over an extended period of time, typically several months.
In the average recession, gross domestic product (GDP) is not the only thing shrinking—incomes, employment, industrial production, and retail sales tend to shrink as well. Economists generally consider two consecutive quarters of declining GDP as a recession.
The general economic model of a recession is that when unemployment rises, consumers are more likely to save than spend. This places pressure on businesses that rely on consumers’ income. As a result, company earnings and stock prices decline, which can fuel a negative cycle of economic decline and negative expectations of returns.
During economic recoveries and expansions, the opposite occurs. Rising employment encourages consumer spending, which bolsters corporate profits and stock market returns.
How Long Do Recessions Last?
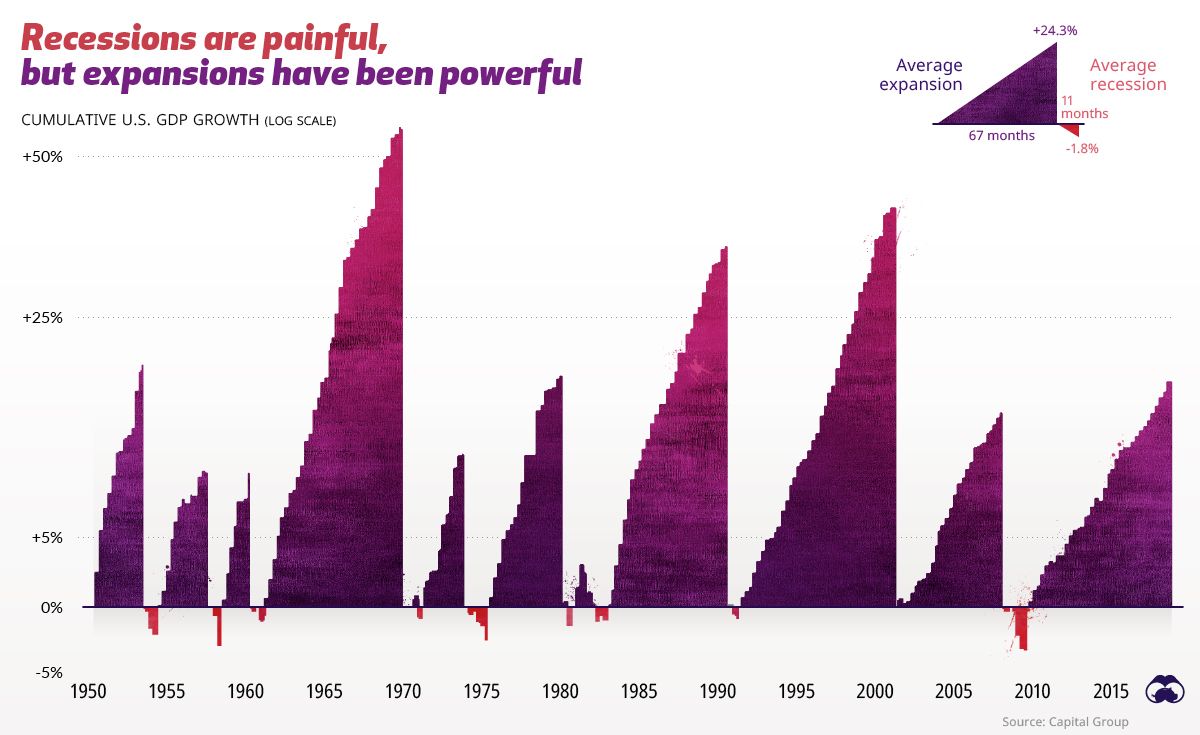
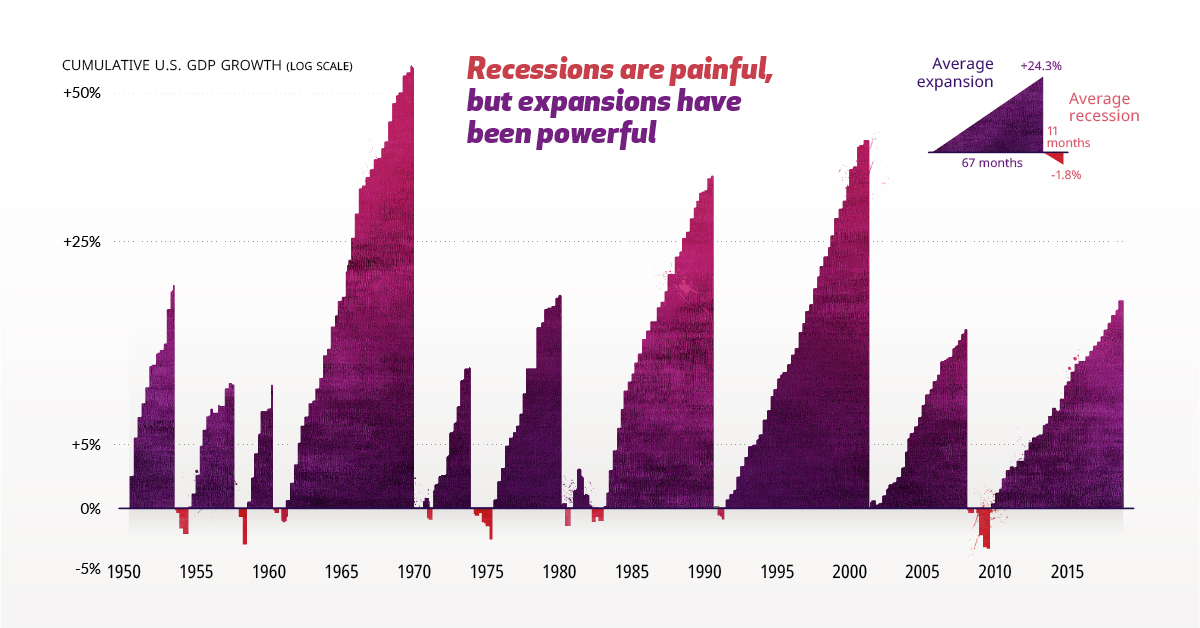
Recessions generally do not last very long. According to Capital Group’s analysis of 10 cycles since 1950, the average length of a recession is 11 months, although they have ranged from eight to 18 months over the period of analysis.
Jobs losses and business closures are dramatic in the short term, though equity investments in the stock market have generally fared better. Throughout the history of economics, recessions have been relatively small blips.
| Average Expansion | Average Recession | |
|---|---|---|
| Months | 67 | 11 |
| GDP Growth | 24.3% | -1.8% |
| S&P 500 Returns | 117% | 3% |
| Net Jobs Added | 12M | -1.9M |
Over the last 65 years, the U.S. has been in an official recession for less than 15% of all months. In addition, the overall economic impact of most recessions is relatively small. The average expansion increased GDP by 24%, whereas the average recession decreased GDP by less than 2%.
In fact, equity returns can be positive throughout a contraction, since some of the strongest stock rallies have occurred in the later stages of a recession.
Buying the Dip: Recession Indicators
Whether you are an investor or not, it would be wise to pay attention to potential recessions and prepare accordingly.
There are several indicators that people can watch to anticipate a potential recession, which might give them an edge in preparing their portfolios:
| Recession Indicator | Why is it Important? | Average Length Until Recession |
|---|---|---|
| Inverted Yield Curve | Often a sign the U.S. Fed has hiked short-term rates too high or investors are seeking long-term bonds over riskier assets. | 15.7 months |
| Corporate Profits | When profits decline, businesses cut investment, employment, and wages. | 26.2 months |
| Unemployment | When unemployment rises, consumers cut back on spending. | 6.1 months |
| Housing Starts | When the economic outlook is poor, home builders often cut back on housing projects. | 5.3 months |
| Leading Economic Index | Aggregation of multiple leading economic indicators. gives a broader look at the U.S. economy. | 4.1 months |
This is not a magic rubric for anticipating every economic downturn, but it helps individuals see the weather patterns on the horizon. Whether and where the storm hits is another question.


Economy
The Most Valuable Companies in Major EU Economies
From semiconductor equipment manufacturers to supercar makers, the EU’s most valuable companies run the gamut of industries.
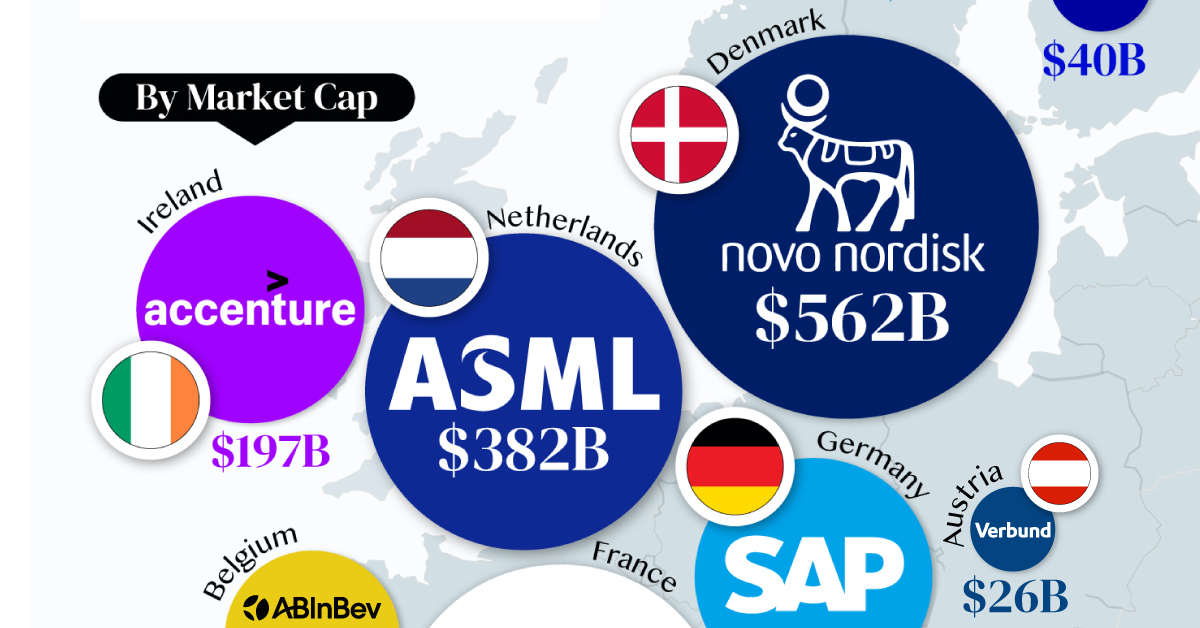
Most Valuable Companies in the EU, by Country
This was originally posted on our Voronoi app. Download the app for free on iOS or Android and discover incredible data-driven charts from a variety of trusted sources.
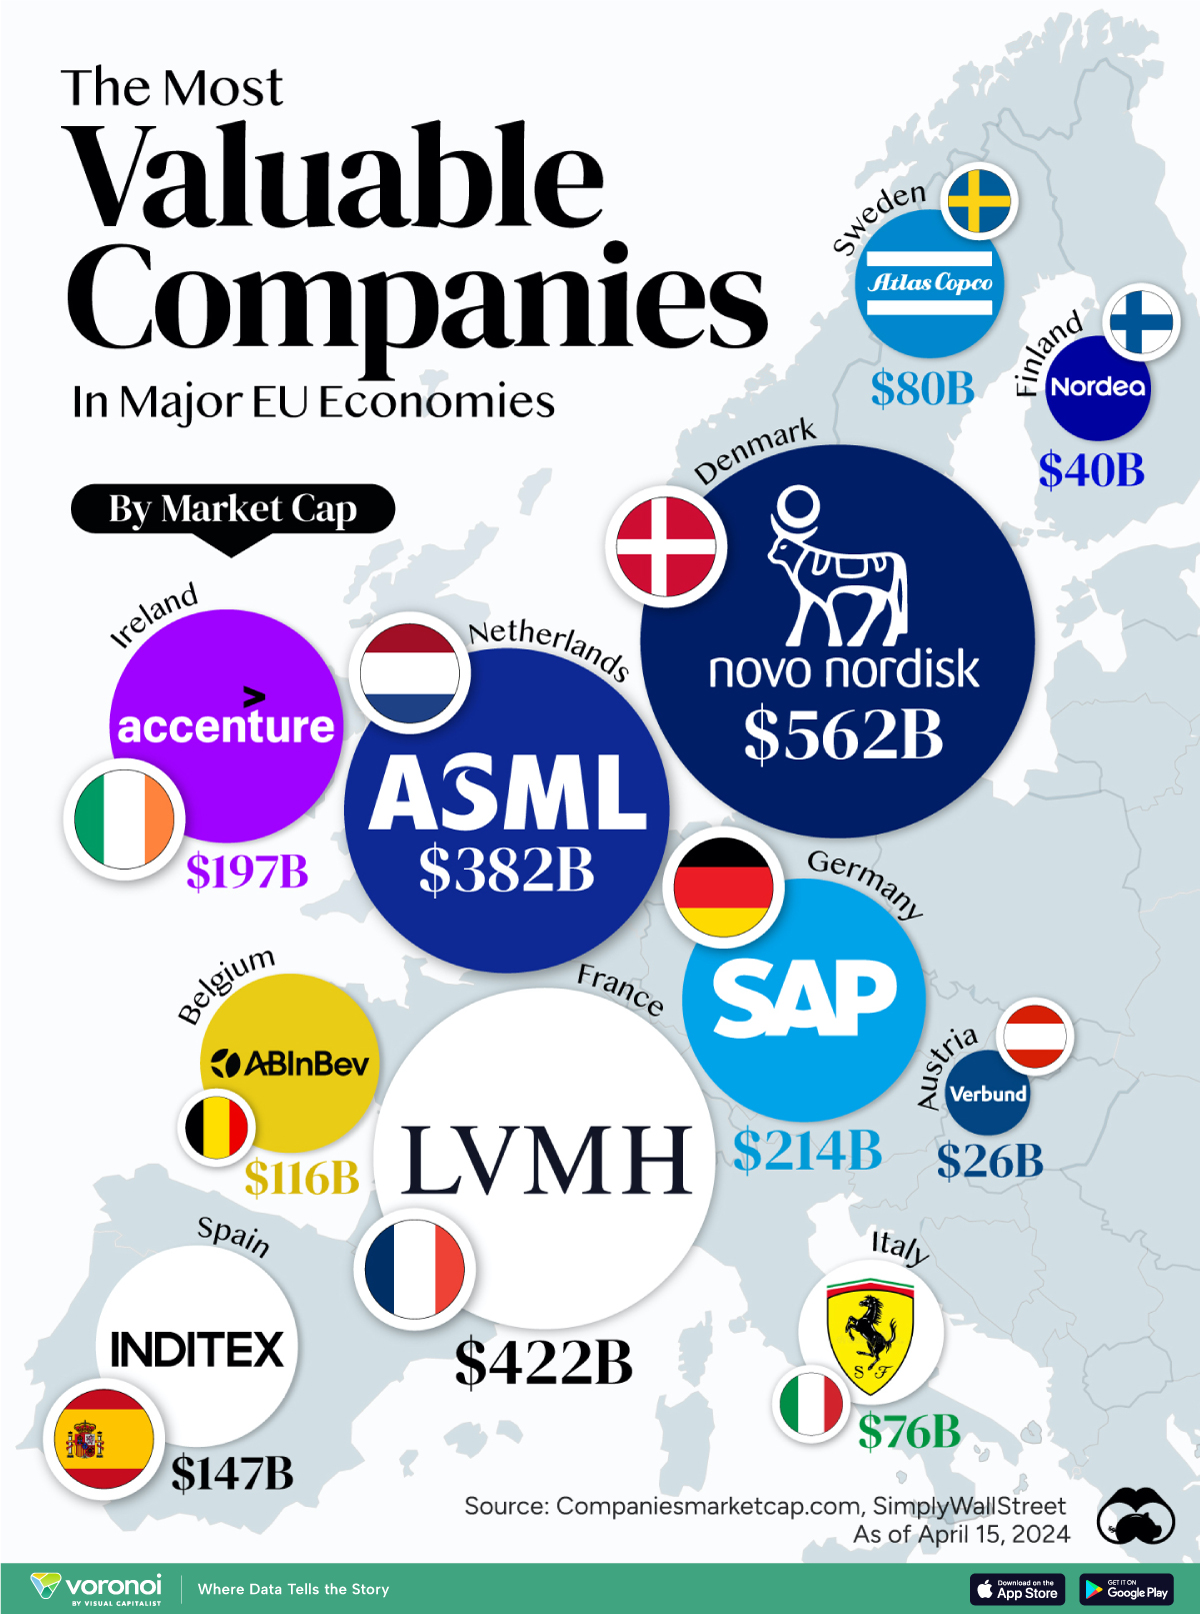
In this graphic, we mapped out the most valuable corporations in 11 major EU economies, based on their market capitalizations as of April 15th, 2024. All figures are in USD, and were sourced from Companiesmarketcap.com.
Novo Nordisk is currently worth more than $550 billion, making it Europe’s most valuable company by a wide margin. The pharmaceutical giant specializes in diabetes and weight-loss drugs. Demand for two of them, Ozempic and Wegovy, has surged due to their weight-loss capabilities, even causing nationwide shortages in the United States.
The following table includes an expanded list of the most valuable publicly-traded company in larger EU economies. Many of these were not included in the graphic due to space limitations.
| Country | Company | Sector | Market Cap |
|---|---|---|---|
| 🇩🇰 Denmark | 💊 Novo Nordisk | Pharmaceuticals | $562B |
| 🇫🇷 France | 👜 LVMH | Luxury Goods | $422B |
| 🇳🇱 Netherlands | 🔧 ASML | Semiconductor Equipment | $382B |
| 🇩🇪 Germany | 💼 SAP | Enterprise Software | $214B |
| 🇮🇪 Ireland | 🖥️ Accenture | IT Services | $197B |
| 🇪🇸 Spain | 👗 Inditex | Retail | $147B |
| 🇧🇪 Belgium | 🍻 Anheuser-Busch InBev | Beverages | $116B |
| 🇸🇪 Sweden | 🛠️ Atlas Copco | Industrial Equipment | $80B |
| 🇮🇹 Italy | 🏎️ Ferrari | Automotive | $76B |
| 🇫🇮 Finland | 🏦 Nordea Bank | Banking | $40B |
| 🇦🇹 Austria | 🔌 Verbund AG | Energy | $26B |
| 🇱🇺 Luxembourg | 🏗️ Tenaris | Oil & Gas Equipment | $22B |
| 🇨🇿 Czech Republic | 💡 CEZ Group | Energy | $20B |
| 🇵🇱 Poland | ⛽ PKN Orlen | Energy | $20B |
| 🇵🇹 Portugal | 🔌 EDP Group | Energy | $16B |
| 🇬🇷 Greece | 🏦 Eurobank | Banking | $7B |
| 🇭🇺 Hungary | ⛽ MOL Group | Energy | $7B |
| 🇭🇷 Croatia | 🏦 Zagrebacka Banka | Banking | $6B |
| 🇷🇴 Romania | ⛽ Romgaz | Energy | $4B |
| 🇸🇮 Slovenia | 💊 Krka | Pharmaceuticals | $4B |
Note: Figures are rounded and last updated on April 15th, 2024. Countries with top publicly-traded companies worth under $4 billion are excluded.
Luxury supergiant LVMH—which owns brands like Tiffany, Christian Dior, and TAG Heuer to name a few—is Europe’s second largest company by market cap, at $420 billion.
Rounding out the top three is ASML, which produces equipment crucial to chip manufacturers, worth $380 billion.
When looking at the region, there is a vast disparity between EU member states and their most valuable companies.
For example, as mentioned earlier, Denmark’s Novo Nordisk and France’s LVMH are worth between $400-550 billion each. Meanwhile, some countries don’t even have a single publicly-listed company that is worth over $1 billion.
In fact, only 12 EU countries (less than half of the union) are home to the top 100 most valuable companies within the bloc. An additional four countries are represented if you look at the list of the top 200 companies.

-

 Technology7 days ago
All of the Grants Given by the U.S. CHIPS Act
-

 Uranium2 weeks ago
The World’s Biggest Nuclear Energy Producers
-

 Education2 weeks ago
How Hard Is It to Get Into an Ivy League School?
-

 Debt2 weeks ago
How Debt-to-GDP Ratios Have Changed Since 2000
-

 Sports2 weeks ago
The Highest Earning Athletes in Seven Professional Sports
-

 Science2 weeks ago
Visualizing the Average Lifespans of Mammals
-

 Brands1 week ago
How Tech Logos Have Evolved Over Time
-

 Energy1 week ago
Ranked: The Top 10 EV Battery Manufacturers in 2023