United States
Ranked: The Most Prescribed Drugs in the U.S.
Ranked: The Most Prescribed Drugs in the U.S.
Every day, millions of people in the U.S. take prescribed drugs to help them live their lives.
As our understanding of medicine has evolved, we’ve been able to develop drugs to aid with some of the most common medical conditions—from pain and blood pressure drugs to asthma medication, thyroid treatments, and antidepressants.
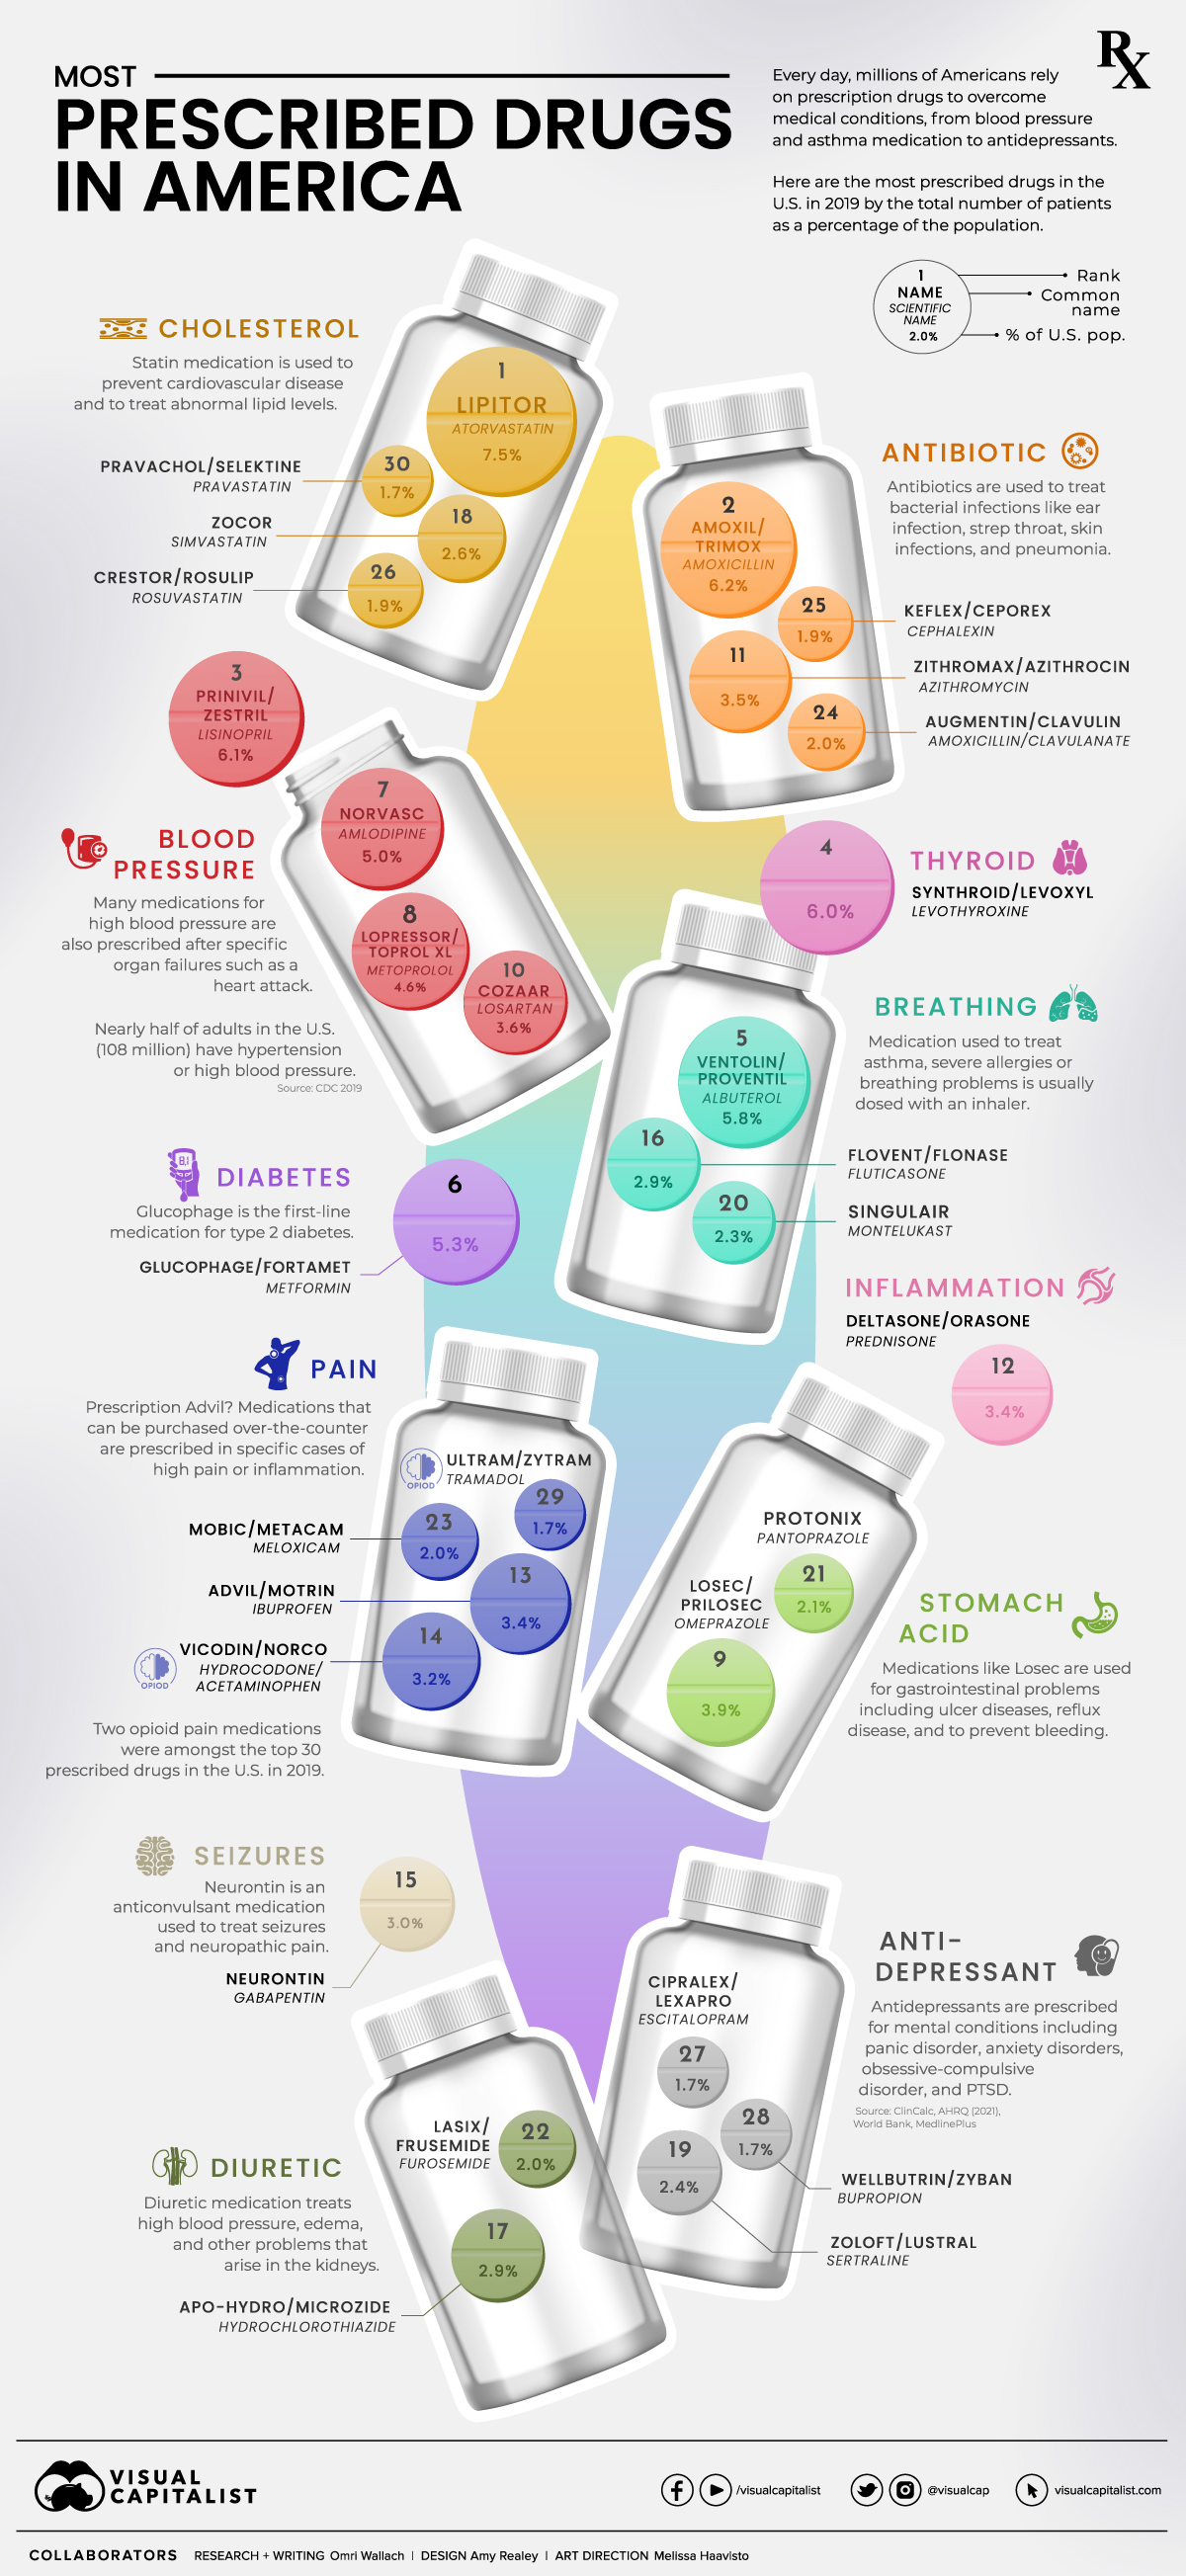
This graphic uses prescribed medicines data from the U.S. Agency for Healthcare Research and Quality, released in 2021 for the 2019 calendar year. It also uses supporting drug and health information from MedlinePlus.
What are the Most Prescribed Drugs in America?
Sorting the annual prescribed medicines data by the total number of patients highlights how important and prevalent some drugs are in America.
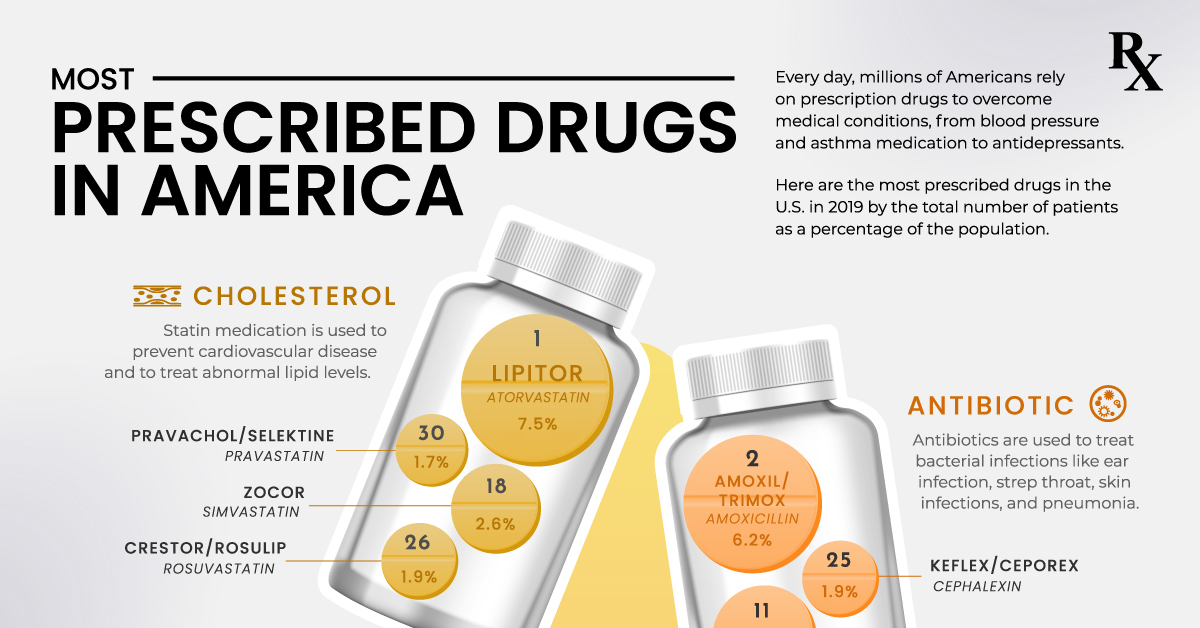
The most prescribed drug, atorvastatin (sold under brand Lipitor), was prescribed to 24.5 million people in the U.S. in 2019, or 7.5% of the population. It was one of many statin medications listed, which are used to prevent cardiovascular disease and treat abnormal lipid levels.
In fact, a majority of the most prescribed drugs in the U.S. are used to treat high blood pressure or symptoms of it. That’s because 108 million or nearly half of adults in the U.S. have hypertension or high blood pressure.
| Drug Name | Total U.S. Patients (2019) | Brand Name | Primary Use |
|---|---|---|---|
| Atorvastatin | 24,493,971 | Lipitor | Cholesterol |
| Amoxicillin | 20,368,921 | Amoxil, Trimox | Antibiotic |
| Lisinopril | 19,990,170 | Prinivil, Zestril | Blood Pressure |
| Levothyroxine | 19,698,087 | Synthroid, Levoxyl | Thyroid |
| Albuterol | 19,085,418 | Ventolin, Proventil | Breathing |
| Metformin | 17,430,765 | Glucophage, Fortamet | Diabetes |
| Amlodipine | 16,419,181 | Norvasc | Blood Pressure |
| Metoprolol | 15,177,787 | Lopressor, Toprol XL | Blood Pressure |
| Omeprazole | 12,869,290 | Losec, Prilosec | Stomach Acid |
| Losartan | 11,760,646 | Cozaar | Blood Pressure |
| Azithromycin | 11,577,286 | Zithromax, Azithrocin | Antibiotic |
| Prednisone | 10,999,246 | Deltasone, Orasone | Inflammation |
| Ibuprofen | 10,951,995 | Advil, Motrin | Pain |
| Hydrocodone/Acetaminophen | 10,409,764 | Vicodin/Norco | Pain (Opioid) |
| Gabapentin | 9,818,634 | Neurontin | Seizures |
| Fluticasone | 9,564,147 | Flovent, Flonase | Breathing |
| Hydrochlorothiazide | 9,358,879 | Apo-Hydro, Microzide | Diuretic |
| Simvastatin | 8,543,612 | Zocor | Cholesterol |
| Sertraline | 7,723,122 | Zoloft, Lustral | Antidepressant |
| Montelukast | 7,429,725 | Singulair | Breathing |
| Pantoprazole | 6,777,996 | Protonix | Stomach Acid |
| Furosemide | 6,640,042 | Lasix, Frusemide | Diuretic |
| Meloxicam | 6,484,210 | Mobic, Metacam | Pain |
| Amoxicillin; Clavulanate | 6,468,086 | Augmentin, Clavulin | Antibiotic |
| Cephalexin | 6,267,878 | Keflex, Ceporex | Antibiotic |
| Rosuvastatin | 6,129,254 | Crestor, Rosulip | Cholesterol |
| Escitalopram | 5,544,406 | Cipralex, Lexapro | Antidepressant |
| Bupropion | 5,520,278 | Wellbutrin, Zyban | Antidepressant |
| Tramadol | 5,496,843 | Ultram, Zytram | Pain (Opioid) |
| Pravastatin | 5,420,488 | Pravachol, Selektine | Cholesterol |
Other common prescriptions include antibiotics like amoxicillin and azithromycin, used to treat bacterial infections, as well as levothyroxine, which was used by 19.7 million Americans to treat thyroid hormone deficiency.
Asthma medication albuterol (usually prescribed through an inhaler) rounded out the top five prescribed drugs with the most patients, followed closely by Type 2 diabetes medication glucophage.
The Top Medical Conditions Treated by Prescription Drugs
The prevalence of cardiovascular-related medication becomes clear when combining the total patients for each type of medication.
The total number of patients with prescribed medication for blood pressure or cholesterol combined for 33% of the U.S. population.
Compared to that, medication for pain or inflammation were the most frequent on the top 30 list with five occurrences, but were only prescribed to 13.6% of people. That includes hydrocodone (known by the brand name Vicodin) and tramadol (known by the brand name Ultram), two opioid medications.
| Primary Use of Prescribed Drug | U.S. Patients as % Pop (2019) |
|---|---|
| Blood Pressure | 19.4% |
| Antibiotic | 13.7% |
| Cholesterol | 13.6% |
| Pain/Inflammation | 13.6% |
| Breathing | 11.0% |
| Thyroid | 6.0% |
| Stomach Acid | 6.0% |
| Antidepressant | 5.7% |
| Diabetes | 5.3% |
| Diuretic | 4.9% |
| Seizures | 3.0% |
Most of the top 30 prescribed medications for specific conditions saw patients total less than 6% of the U.S. population. They include thyroid issues, gastrointestinal conditions, and mental conditions treated by antidepressants (including panic disorder, anxiety disorders, and PTSD).
But it’s important to remember that some patients have multiple prescriptions for serious conditions with multiple symptoms, or comorbid conditions—when more than one disease or condition is present at the same time.
Drug Spending in the U.S.
A prescribed drug’s total number of patients doesn’t necessarily reflect how important it is, or how expensive it is for the end user.
Levothyroxine is the fourth-most prescribed drug by total patients, but the second-most prescribed drug by total prescriptions with 102.6 million in 2019 at an average cost of $25.10 per prescription.
More specialized medication like fluticasone had significantly less total prescriptions with 27.9 million, but an average cost of $97.68 per prescription.
Prices are influenced by a drug’s demand, whether or not it’s patented or available in generic form, and a country’s healthcare system. As far as OECD countries go, the U.S. ranks as the most costly almost across the board.
Since the current rankings look at the U.S. pre-COVID, next year’s prescription data will be illuminating as to the state of American health (and healthcare).
United States
Ranked: The Largest U.S. Corporations by Number of Employees
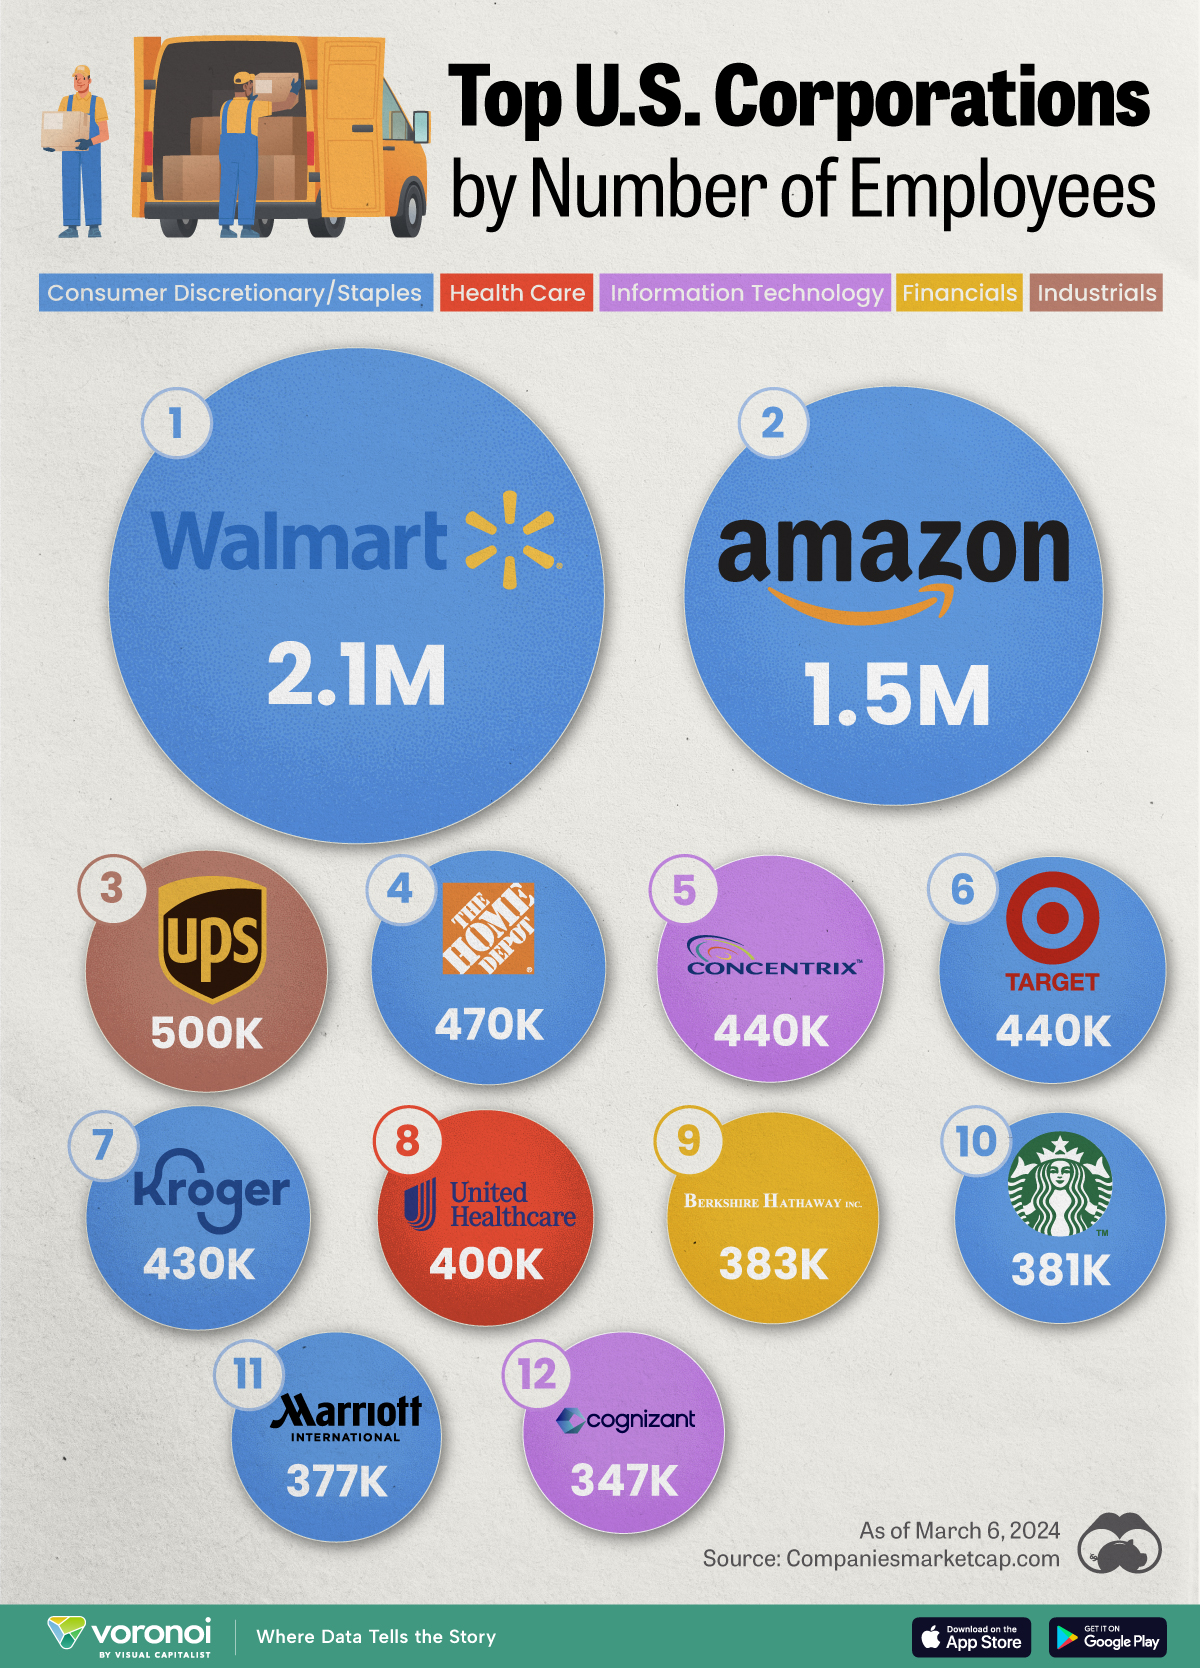
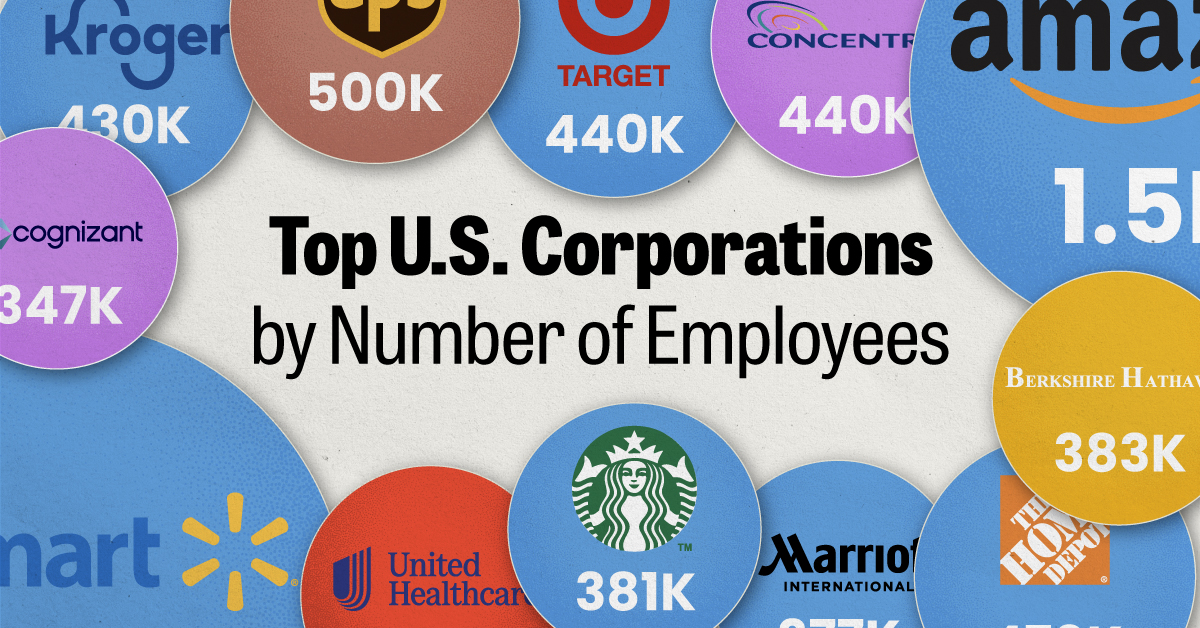
We visualized the top U.S. companies by employees, revealing the massive scale of retailers like Walmart, Target, and Home Depot.
The Largest U.S. Corporations by Number of Employees
This was originally posted on our Voronoi app. Download the app for free on Apple or Android and discover incredible data-driven charts from a variety of trusted sources.
Revenue and profit are common measures for measuring the size of a business, but what about employee headcount?
To see how big companies have become from a human perspective, we’ve visualized the top U.S. companies by employees. These figures come from companiesmarketcap.com, and were accessed in March 2024. Note that this ranking includes publicly-traded companies only.
Data and Highlights
The data we used to create this list of largest U.S. corporations by number of employees can be found in the table below.
| Company | Sector | Number of Employees |
|---|---|---|
| Walmart | Consumer Staples | 2,100,000 |
| Amazon | Consumer Discretionary | 1,500,000 |
| UPS | Industrials | 500,000 |
| Home Depot | Consumer Discretionary | 470,000 |
| Concentrix | Information Technology | 440,000 |
| Target | Consumer Staples | 440,000 |
| Kroger | Consumer Staples | 430,000 |
| UnitedHealth | Health Care | 400,000 |
| Berkshire Hathaway | Financials | 383,000 |
| Starbucks | Consumer Discretionary | 381,000 |
| Marriott International | Consumer Discretionary | 377,000 |
| Cognizant | Information Technology | 346,600 |
Retail and Logistics Top the List
Companies like Walmart, Target, and Kroger have a massive headcount due to having many locations spread across the country, which require everything from cashiers to IT professionals.
Moving goods around the world is also highly labor intensive, explaining why UPS has half a million employees globally.
Below the Radar?
Two companies that rank among the largest U.S. corporations by employees which may be less familiar to the public include Concentrix and Cognizant. Both of these companies are B2B brands, meaning they primarily work with other companies rather than consumers. This contrasts with brands like Amazon or Home Depot, which are much more visible among average consumers.
A Note on Berkshire Hathaway
Warren Buffett’s company doesn’t directly employ 383,000 people. This headcount actually includes the employees of the firm’s many subsidiaries, such as GEICO (insurance), Dairy Queen (retail), and Duracell (batteries).
If you’re curious to see how Buffett’s empire has grown over the years, check out this animated graphic that visualizes the growth of Berkshire Hathaway’s portfolio from 1994 to 2022.
-

 Energy1 week ago
The World’s Biggest Nuclear Energy Producers
-

 Money2 weeks ago
Which States Have the Highest Minimum Wage in America?
-

 Technology2 weeks ago
Ranked: Semiconductor Companies by Industry Revenue Share
-

 Markets2 weeks ago
Ranked: The World’s Top Flight Routes, by Revenue
-

 Countries2 weeks ago
Population Projections: The World’s 6 Largest Countries in 2075
-

 Markets2 weeks ago
The Top 10 States by Real GDP Growth in 2023
-

 Demographics2 weeks ago
The Smallest Gender Wage Gaps in OECD Countries
-

 United States2 weeks ago
Where U.S. Inflation Hit the Hardest in March 2024


