Automotive
Ranked: The Autonomous Vehicle Readiness of 20 Countries
For the past decade, manufacturers and governments all over the world have been preparing for the adoption of self-driving cars—with the promise of transformative economic development.
As autonomous vehicles become more of a looming certainty, what will be the wider impacts of this monumental transition?
Which Countries are Ready?
Today’s interactive visual from Aquinov Mathappan ranks countries on their preparedness to adopt self-driving cars, while also exploring the range of challenges they will face in achieving complete automation.
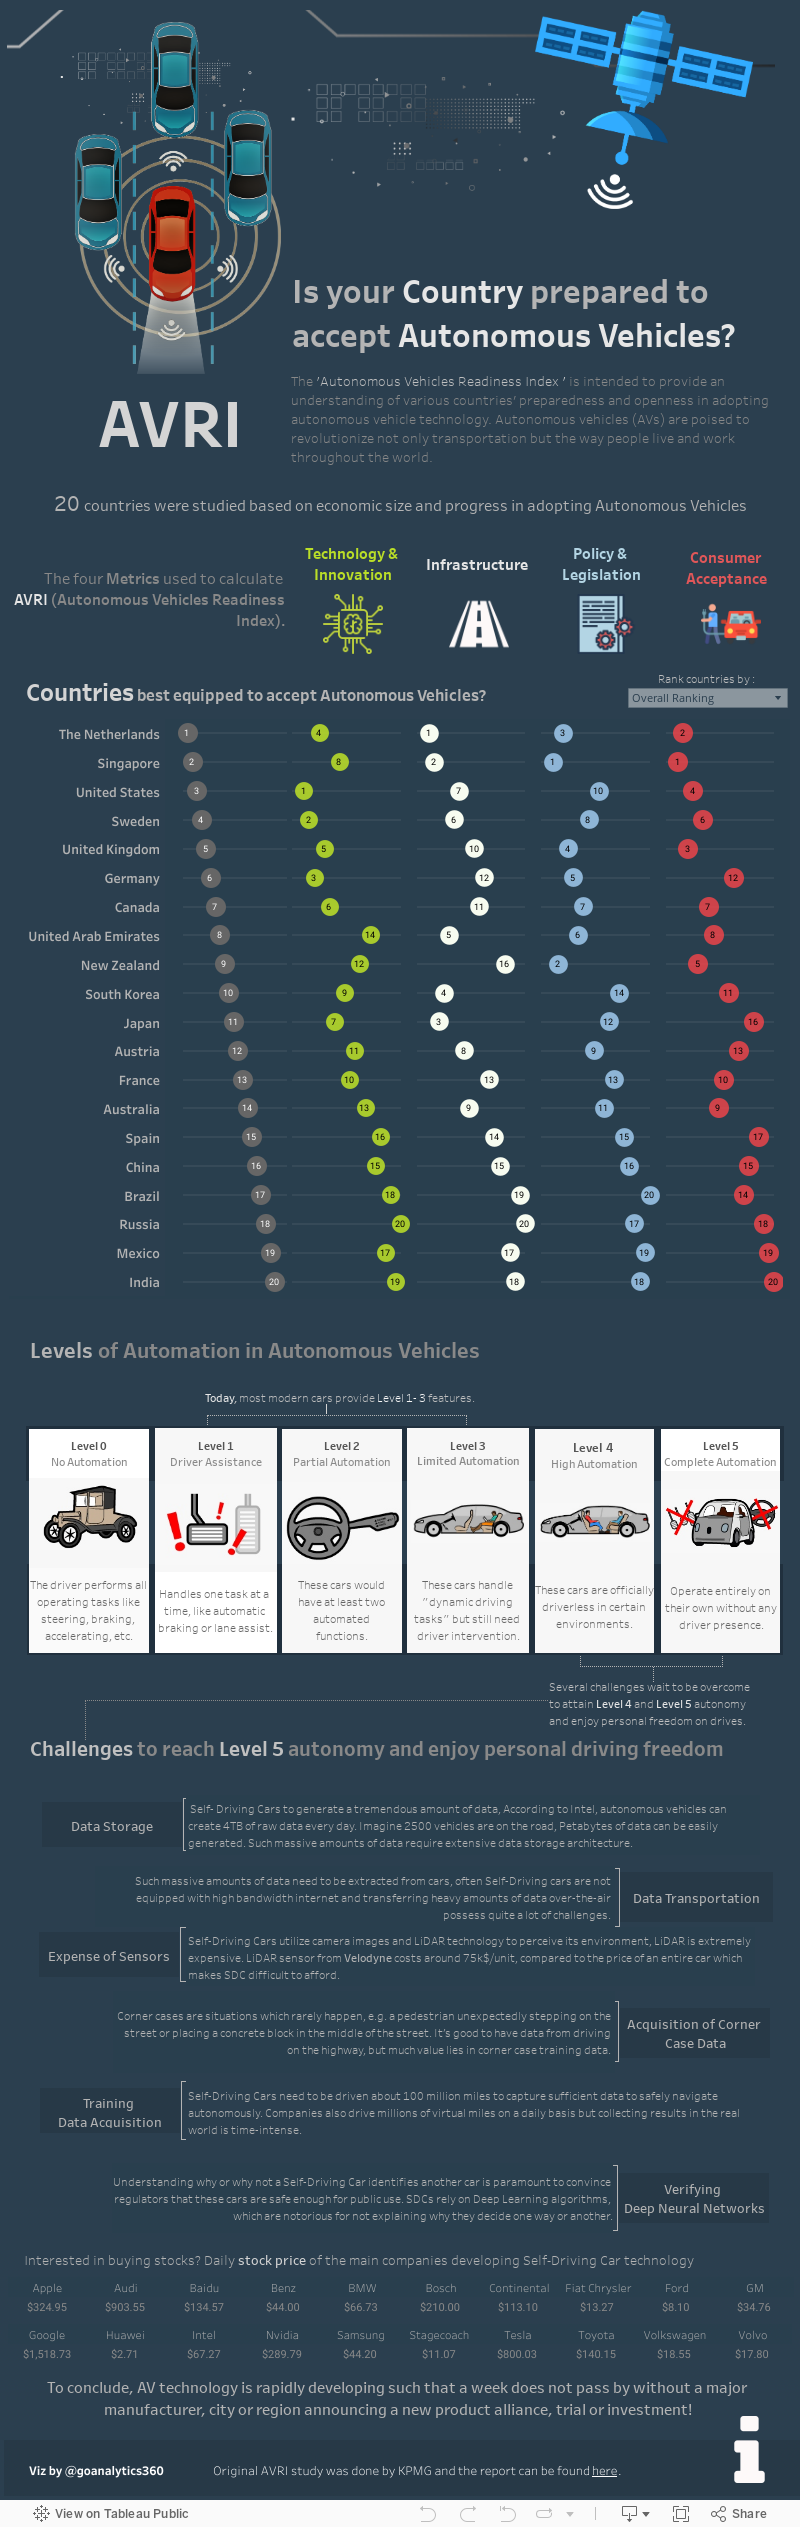
The Five Levels of Automation
The graphic above uses the Autonomous Vehicles Readiness Index, which details the five levels of automation. Level 0 vehicles place the responsibility for all menial tasks with the driver, including steering, braking, and acceleration. In contrast, level 5 vehicles demand nothing of the driver and can operate entirely without their presence.
Today, most cars sit between levels 1 and 3, typically with few or limited automated functions. There are some exceptions to the rule, such as certain Tesla models and Google’s Waymo. Both feature a full range of self-driving capabilities—enabling the car to steer, accelerate and brake on behalf of the driver.
The Journey to Personal Driving Freedom
There are three main challenges that come with achieving a fully-automated level 5 status:
- Data Storage
Effectively storing data and translating it into actionable insights is difficult when 4TB of raw data is generated every day—the equivalent of the data generated by 3,000 internet users in 24 hours. - Data Transportation
Autonomous vehicles need to communicate with each other and transport data with the use of consistently high-speed internet, highlighting the need for large-scale adoption of 5G. - Verifying Deep Neural Networks
The safety of these vehicles will be dictated by their ability to distinguish between a vehicle and a person, but they currently rely on algorithms which are not yet fully understood.
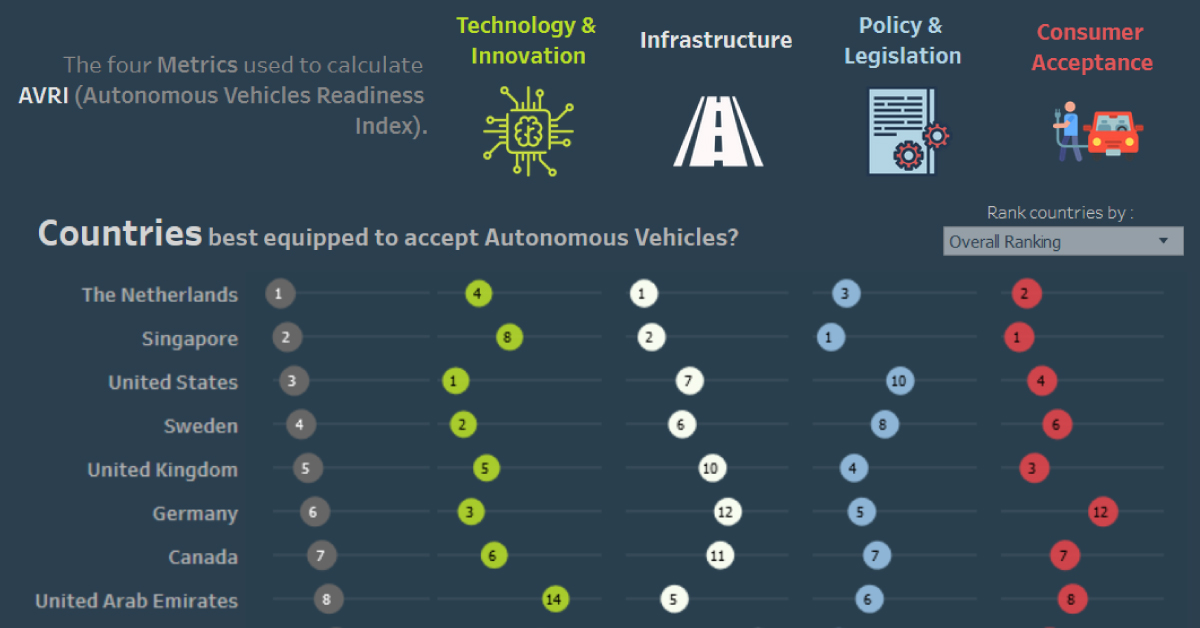
Which Countries are Leading the Charge?
The 20 countries were selected for the report based on economic size, and their automation progress was ranked using four key metrics: technology and innovation, infrastructure, policy and legislation, and consumer acceptance.
The United States leads the way on technology and innovation, with 163 company headquarters, and more than 50% of cities currently preparing their streets for self-driving vehicles. The Netherlands and Singapore rank in the top three for infrastructure, legislation, and consumer acceptance. Singapore is currently testing a fleet of autonomous buses created by Volvo, which will join the existing public transit fleet in 2022.
India, Mexico, and Russia lag behind on all fronts—despite enthusiasm for self-driving cars, these countries require legislative changes and improvements in the existing quality of roads. Mexico also lacks industrial activity and clear regulations around autonomous vehicles, but close proximity to the U.S. has already garnered interest from companies like Intel for manufacturing autonomous vehicles south of the border.
How Autonomous Vehicles Impact the Economy
Once successfully adopted, autonomous vehicles will save the U.S. economy $1.3 trillion per year, which will come from a variety of sources including:
- $563 billion: Reduction in accidents
- $422 billion: Productivity gains
- $158 billion: Decline in fuel costs
- $138 billion: Fuel savings from congestion avoidance
- $11 billion: Improved traffic flow and reduction of energy use
- Insurance
Transportation will be safer, potentially reducing the number of accidents over time. Insurance companies are already rolling out usage-based insurance policies (UBIs), which charge customers based on how many miles they drive and how safe their driving habits are. - Travel
Long distance traveling in autonomous vehicles provides a painless alternative to train and air travel. The vehicles are designed for comfort, making it possible to sleep overnight easily—which could also impact the hotel industry significantly. - Real Estate
An increase in effortless travel could lead to increased urban sprawl, as people prioritize the convenience of proximity to city centers less and less.
With the adoption of autonomous vehicles projected to reduce private car ownership in the U.S. to 43% by 2030, it’s disrupting many other industries in the process.
Defining the parameters for this emerging industry will present significant and unpredictable challenges. Once the initial barriers are eliminated and the technology matures, the world could see a new renaissance of mobility, and the disruption of dozens of other industries as a result.


Lithium
Ranked: The Top 10 EV Battery Manufacturers in 2023
Asia dominates this ranking of the world’s largest EV battery manufacturers in 2023.


The Top 10 EV Battery Manufacturers in 2023
This was originally posted on our Voronoi app. Download the app for free on iOS or Android and discover incredible data-driven charts from a variety of trusted sources.
Despite efforts from the U.S. and EU to secure local domestic supply, all major EV battery manufacturers remain based in Asia.
In this graphic we rank the top 10 EV battery manufacturers by total battery deployment (measured in megawatt-hours) in 2023. The data is from EV Volumes.
Chinese Dominance
Contemporary Amperex Technology Co. Limited (CATL) has swiftly risen in less than a decade to claim the title of the largest global battery group.
The Chinese company now has a 34% share of the market and supplies batteries to a range of made-in-China vehicles, including the Tesla Model Y, SAIC’s MG4/Mulan, and various Li Auto models.
| Company | Country | 2023 Production (megawatt-hour) | Share of Total Production |
|---|---|---|---|
| CATL | 🇨🇳 China | 242,700 | 34% |
| BYD | 🇨🇳 China | 115,917 | 16% |
| LG Energy Solution | 🇰🇷 Korea | 108,487 | 15% |
| Panasonic | 🇯🇵 Japan | 56,560 | 8% |
| SK On | 🇰🇷 Korea | 40,711 | 6% |
| Samsung SDI | 🇰🇷 Korea | 35,703 | 5% |
| CALB | 🇨🇳 China | 23,493 | 3% |
| Farasis Energy | 🇨🇳 China | 16,527 | 2% |
| Envision AESC | 🇨🇳 China | 8,342 | 1% |
| Sunwoda | 🇨🇳 China | 6,979 | 1% |
| Other | - | 56,040 | 8% |
In 2023, BYD surpassed LG Energy Solution to claim second place. This was driven by demand from its own models and growth in third-party deals, including providing batteries for the made-in-Germany Tesla Model Y, Toyota bZ3, Changan UNI-V, Venucia V-Online, as well as several Haval and FAW models.
The top three battery makers (CATL, BYD, LG) collectively account for two-thirds (66%) of total battery deployment.
Once a leader in the EV battery business, Panasonic now holds the fourth position with an 8% market share, down from 9% last year. With its main client, Tesla, now sourcing batteries from multiple suppliers, the Japanese battery maker seems to be losing its competitive edge in the industry.
Overall, the global EV battery market size is projected to grow from $49 billion in 2022 to $98 billion by 2029, according to Fortune Business Insights.

-

 Mining1 week ago
Gold vs. S&P 500: Which Has Grown More Over Five Years?
-

 Markets2 weeks ago
Ranked: The Most Valuable Housing Markets in America
-

 Money2 weeks ago
Which States Have the Highest Minimum Wage in America?
-

 AI2 weeks ago
Ranked: Semiconductor Companies by Industry Revenue Share
-

 Markets2 weeks ago
Ranked: The World’s Top Flight Routes, by Revenue
-

 Countries2 weeks ago
Population Projections: The World’s 6 Largest Countries in 2075
-

 Markets2 weeks ago
The Top 10 States by Real GDP Growth in 2023
-

 Demographics2 weeks ago
The Smallest Gender Wage Gaps in OECD Countries