Mining
Palladium: The Secret Weapon in Fighting Pollution
Despite the growing hype around electric vehicles, conventional gas-powered vehicles are expected to be on the road well into the future.
As a result, exhaust systems will continue to be a critical tool in reducing harmful air pollution.
The Power of Palladium
Today’s infographic comes to us from North American Palladium, and it demonstrates the unique properties of the precious metal, and how it’s used in catalytic converters around the world.
In fact, palladium enables car manufacturers to meet stricter emission standards, making it a secret weapon for fighting pollution going forward.

The world is in critical need of palladium today.
It’s the crucial metal in reducing harmful emissions from gas powered vehicles—as environmental standards tighten, cars are using more and more palladium, straining global supplies.
What is Palladium?
Palladium is one of six platinum group metals which share similar chemical, physical, and structural features. Palladium has many uses, but the majority of global consumption comes from the autocatalyst industry.
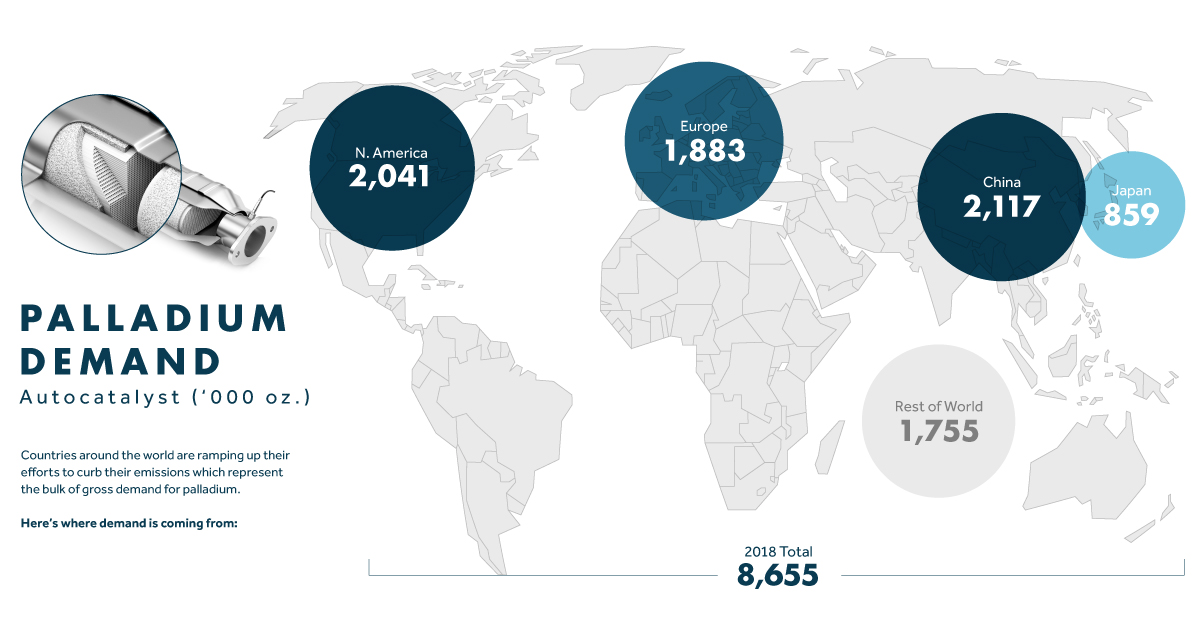
In 2018, total gross demand for the metal was 10,121 million ounces (Moz), of which 8,655 Moz went to autocatalysts. These were the leading regions by demand:
- North America: 2,041 Moz
- Europe: 1,883 Moz
- China: 2,117 Moz
- Japan: 859 Moz
- Rest of the World: 1,755 Moz
Catalytic Converters: Palladium vs. Platinum
The combustion of gasoline creates three primary pollutants: hydrocarbons, nitrogen oxides, and carbon monoxide. Catalytic converters work to alter these poisonous and often dangerous chemicals into safer compounds.
In order to control emissions, countries around the world have come up with strict emissions standards that auto manufacturers must meet, but these are far from the reality of how much pollutants are emitted by drivers every day.
Since no one drives in a straight line or in perfect conditions, stricter emissions testing is coming into effect. Known as Real Driving Emissions (RDE), these tests reveal that palladium performs much better than platinum in a typical driving situation.
In addition, the revelation of the Volkswagen emission scandal (known as Dieselgate) further undermines platinum use in vehicles. As a result, diesel engines are being phased out in favor of gas-powered vehicles that use palladium.
Where does Palladium Come From?
If the world is using all this palladium, where is it coming from?
Approximately, 90% of the world’s palladium production comes as a byproduct of mining other metals, with the remaining 10% coming from primary production.
In 2018, there was a total of 6.88 million ounces of mine supply primarily coming from Russia and South Africa. Conflicts in these jurisdictions present significant risks to the global supply chain. There are few North American jurisdictions, such as Ontario and Montana, which present an opportunity for more stable primary production of palladium.
Long Road to Extinction
The current price of palladium is driven by fundamental supply and demand issues, not investor speculation. Between 2012 and 2018, an accumulated deficit of five million ounces has placed pressures on readily available supplies of above-ground palladium.
Vehicles with internal combustion engines (ICE) will continue to dominate the roads well into the future. According to Bloomberg New Energy Finance, it will not be until 2040 that ICE vehicles will dip below 50% of new car sales market, in favor of plug-in and hybrid vehicles. Stricter emissions standards will further bolster palladium demand.
The world needs stable and steady supplies of palladium today, and well into the future.
Lithium
Ranked: The Top 10 EV Battery Manufacturers in 2023
Asia dominates this ranking of the world’s largest EV battery manufacturers in 2023.

The Top 10 EV Battery Manufacturers in 2023
This was originally posted on our Voronoi app. Download the app for free on iOS or Android and discover incredible data-driven charts from a variety of trusted sources.
Despite efforts from the U.S. and EU to secure local domestic supply, all major EV battery manufacturers remain based in Asia.
In this graphic we rank the top 10 EV battery manufacturers by total battery deployment (measured in megawatt-hours) in 2023. The data is from EV Volumes.
Chinese Dominance
Contemporary Amperex Technology Co. Limited (CATL) has swiftly risen in less than a decade to claim the title of the largest global battery group.
The Chinese company now has a 34% share of the market and supplies batteries to a range of made-in-China vehicles, including the Tesla Model Y, SAIC’s MG4/Mulan, and various Li Auto models.
| Company | Country | 2023 Production (megawatt-hour) | Share of Total Production |
|---|---|---|---|
| CATL | 🇨🇳 China | 242,700 | 34% |
| BYD | 🇨🇳 China | 115,917 | 16% |
| LG Energy Solution | 🇰🇷 Korea | 108,487 | 15% |
| Panasonic | 🇯🇵 Japan | 56,560 | 8% |
| SK On | 🇰🇷 Korea | 40,711 | 6% |
| Samsung SDI | 🇰🇷 Korea | 35,703 | 5% |
| CALB | 🇨🇳 China | 23,493 | 3% |
| Farasis Energy | 🇨🇳 China | 16,527 | 2% |
| Envision AESC | 🇨🇳 China | 8,342 | 1% |
| Sunwoda | 🇨🇳 China | 6,979 | 1% |
| Other | - | 56,040 | 8% |
In 2023, BYD surpassed LG Energy Solution to claim second place. This was driven by demand from its own models and growth in third-party deals, including providing batteries for the made-in-Germany Tesla Model Y, Toyota bZ3, Changan UNI-V, Venucia V-Online, as well as several Haval and FAW models.
The top three battery makers (CATL, BYD, LG) collectively account for two-thirds (66%) of total battery deployment.
Once a leader in the EV battery business, Panasonic now holds the fourth position with an 8% market share, down from 9% last year. With its main client, Tesla, now sourcing batteries from multiple suppliers, the Japanese battery maker seems to be losing its competitive edge in the industry.
Overall, the global EV battery market size is projected to grow from $49 billion in 2022 to $98 billion by 2029, according to Fortune Business Insights.
-

 Science1 week ago
Visualizing the Average Lifespans of Mammals
-

 Demographics2 weeks ago
The Smallest Gender Wage Gaps in OECD Countries
-

 United States2 weeks ago
Where U.S. Inflation Hit the Hardest in March 2024
-

 Green2 weeks ago
Top Countries By Forest Growth Since 2001
-

 United States2 weeks ago
Ranked: The Largest U.S. Corporations by Number of Employees
-

 Maps2 weeks ago
The Largest Earthquakes in the New York Area (1970-2024)
-

 Green2 weeks ago
Ranked: The Countries With the Most Air Pollution in 2023
-

 Green2 weeks ago
Ranking the Top 15 Countries by Carbon Tax Revenue


