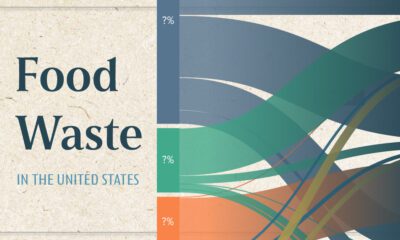
This chart visualizes the flow of the 80 millions tons of food waste in the United States in 2021, using...


click for more →


Scan with your phone's camera or QR code app to view


This infographic examines 50 years of data to highlight a clear visual trend: recessions are preceded by a cyclical low in unemployment.
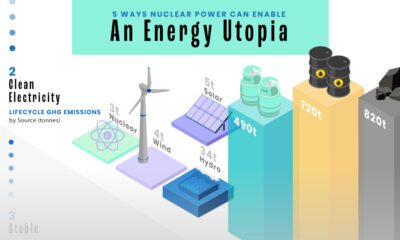

From clean electricity to high reliability, this graphic explores the five key advantages of nuclear power in the clean energy transition.
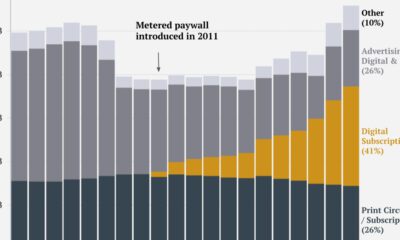

This graphic tracks the New York Times’ revenue streams over the past two decades, identifying its transition from advertising to subscription-reliant.
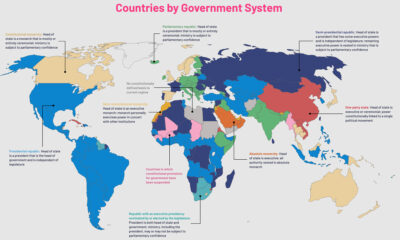

The political regimes of the world's countries have changed over centuries. This map charts the nine government systems that rule the world today.


Where do the happiest people on earth live? This map is a snapshot of the world's most (and least) happy countries in 2023.
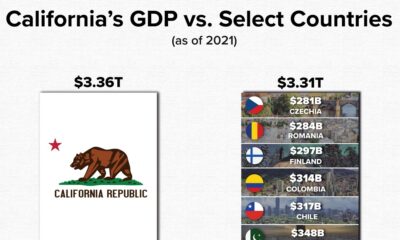

California’s GDP makes the state one of the most powerful economies in the world. This graphic compares it to the GDP of 10 select countries.
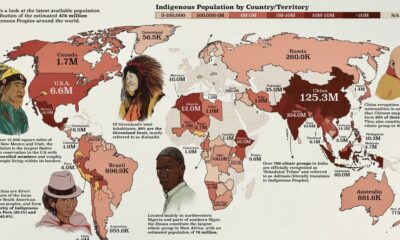

This map by shows the population distribution of the roughly 476 million Indigenous groups around the world.
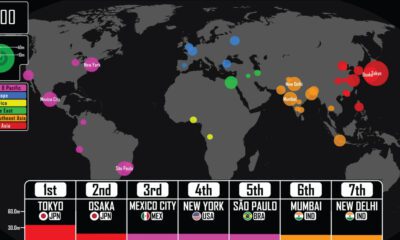

Where were the largest cities in the world throughout history? This video details the rise (and fall) of the largest cities by population from 3,000 BCE.
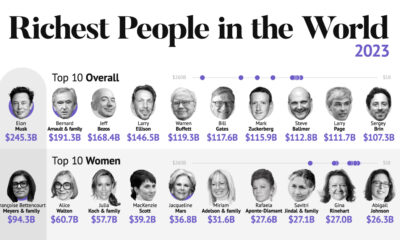

The world's five richest people are worth a combined $871 billion. From luxury moguls to Asia's rising titans, we show the richest in 2023.
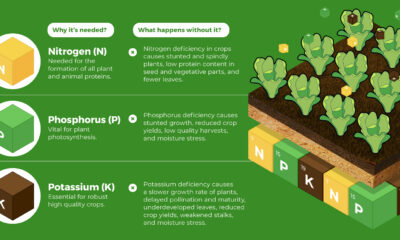

Fertilizer usage dates back to as early as 6,000 to 2,400 BC and remains just as crucial for crop production today.


Globally, central banks bought a record 1,136 tonnes of gold in 2022. How has central bank gold demand changed over the last three decades?


This infographic shows the net minimum wage across 67 countries, as of January 2023. A breakdown by U.S. state is also included.
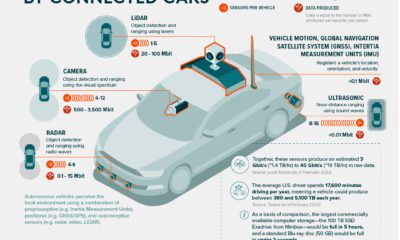

By 2025, connected cars could produce 10 exabytes (exabyte = 1B gigabytes) of data per month, a thousand-fold increase over current volumes.


After a borrowing spree during COVID-19, younger Americans are struggling to keep up with their auto loan payments.
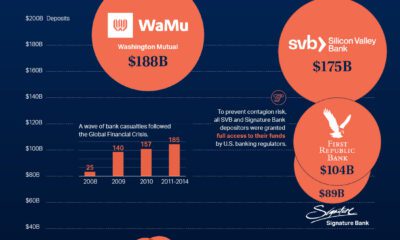

This graphic charts over 560 U.S. bank failures since 2001, including the most recent addition: First Republic Bank.
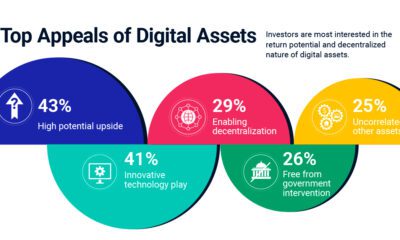

Digital assets are gaining popularity due to their return potential and decentralized nature. How can institutional investors get exposure?
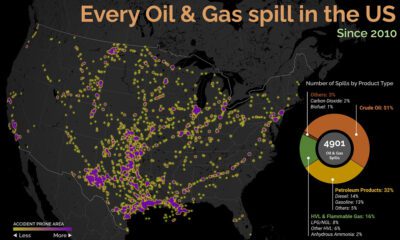

Oil and gas spills can be messy, but where are they most likely to occur? This graphic looks at oil and gas spills in the U.S....


 Creator Program