Water
NASA Satellites Show Disturbing Trends in Water Supply
NASA launched a satellite mission in 2002 that has been transmitting data to us over a decade now. The mission is called GRACE, which stands for Gravity Recovery and Climate Experiment, and it measures the amount of water held underground in aquifers.
Aquifers are underground layers of water-bearing permeable rock from which groundwater can be extracted with water wells. About 30% of all of the world’s freshwater resources are located in aquifers.
Data from NASA’s program was revealed in a recent study, which concluded that 21 of the 37 largest aquifers (57%) are running out too fast to be replenished. Even more concerning: an additional 13 are declining at a rate that puts them in a category NASA calls the “most troubled”.
This is putting us closer to peak water territory.
In the below map, red shades show negative changes in the water supply in the world’s biggest aquifers.
Trends in Groundwater Storage, 2003-2013
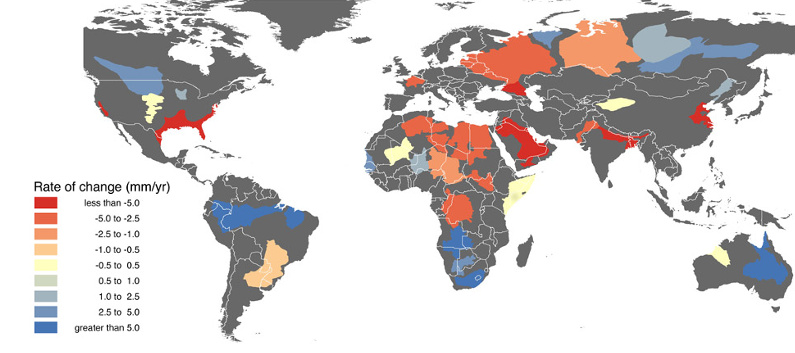
The biggest water sources exert strong gravitational pulls on the satellites, and NASA can use this data to spot trends in water supply while monitoring the world’s largest sources of groundwater.
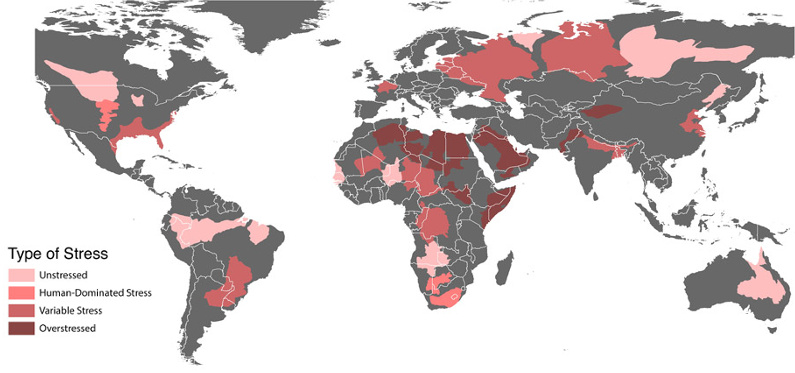
The below map shows the type of stress exhibited on each water source. Overstressed aquifers do not experience any replenishment, while variable stress means that an aquifer is in decline but still experiences some sort of replenishment. Lastly, human-dominated stress means that aquifer levels will not increase unless humans help recharge the wells through irrigation or other methods.
Changes in Storage vs. Aquifer Stress
Keep in mind that these are all of the world’s best aquifers, and that changes in smaller groundwater sources are not well reflected in the study. In the United States, it is expected that 40 of 50 states have at least one region that will see some kind of a water shortage in the next 10 years.
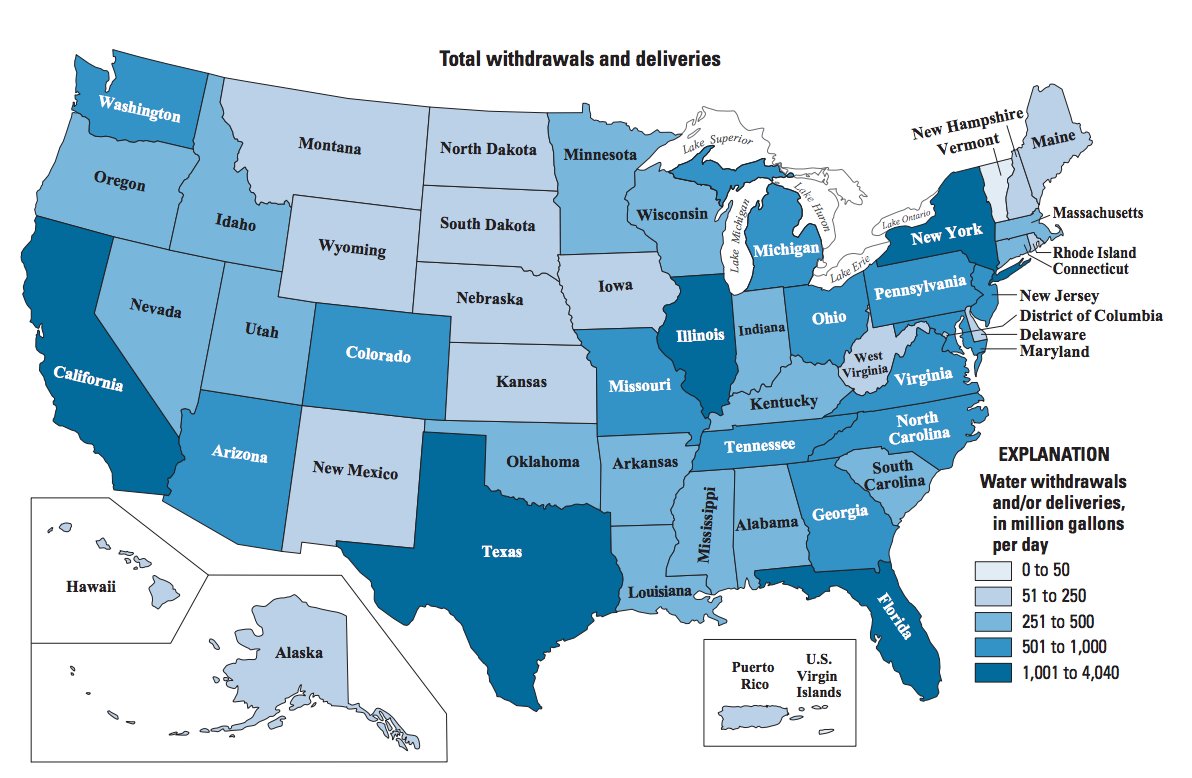
California, which is struck by a historical drought, currently relies on 60% of its water from aquifers. For more information on the water challenges faced in the United States, don’t forget to take a look at America’s Water Crisis.
Source: Circle of Blue, Business Insider


Green
Visualizing All of the World’s Water
See all of the world’s water in one chart, as well as which regions will suffer the greatest from water scarcity.
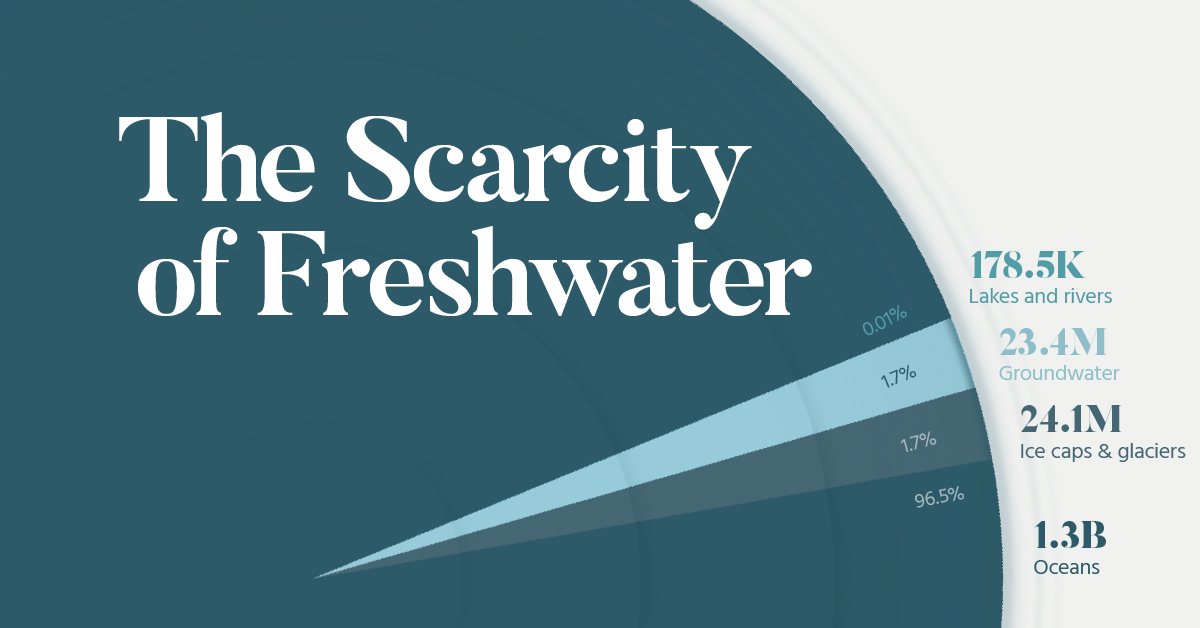
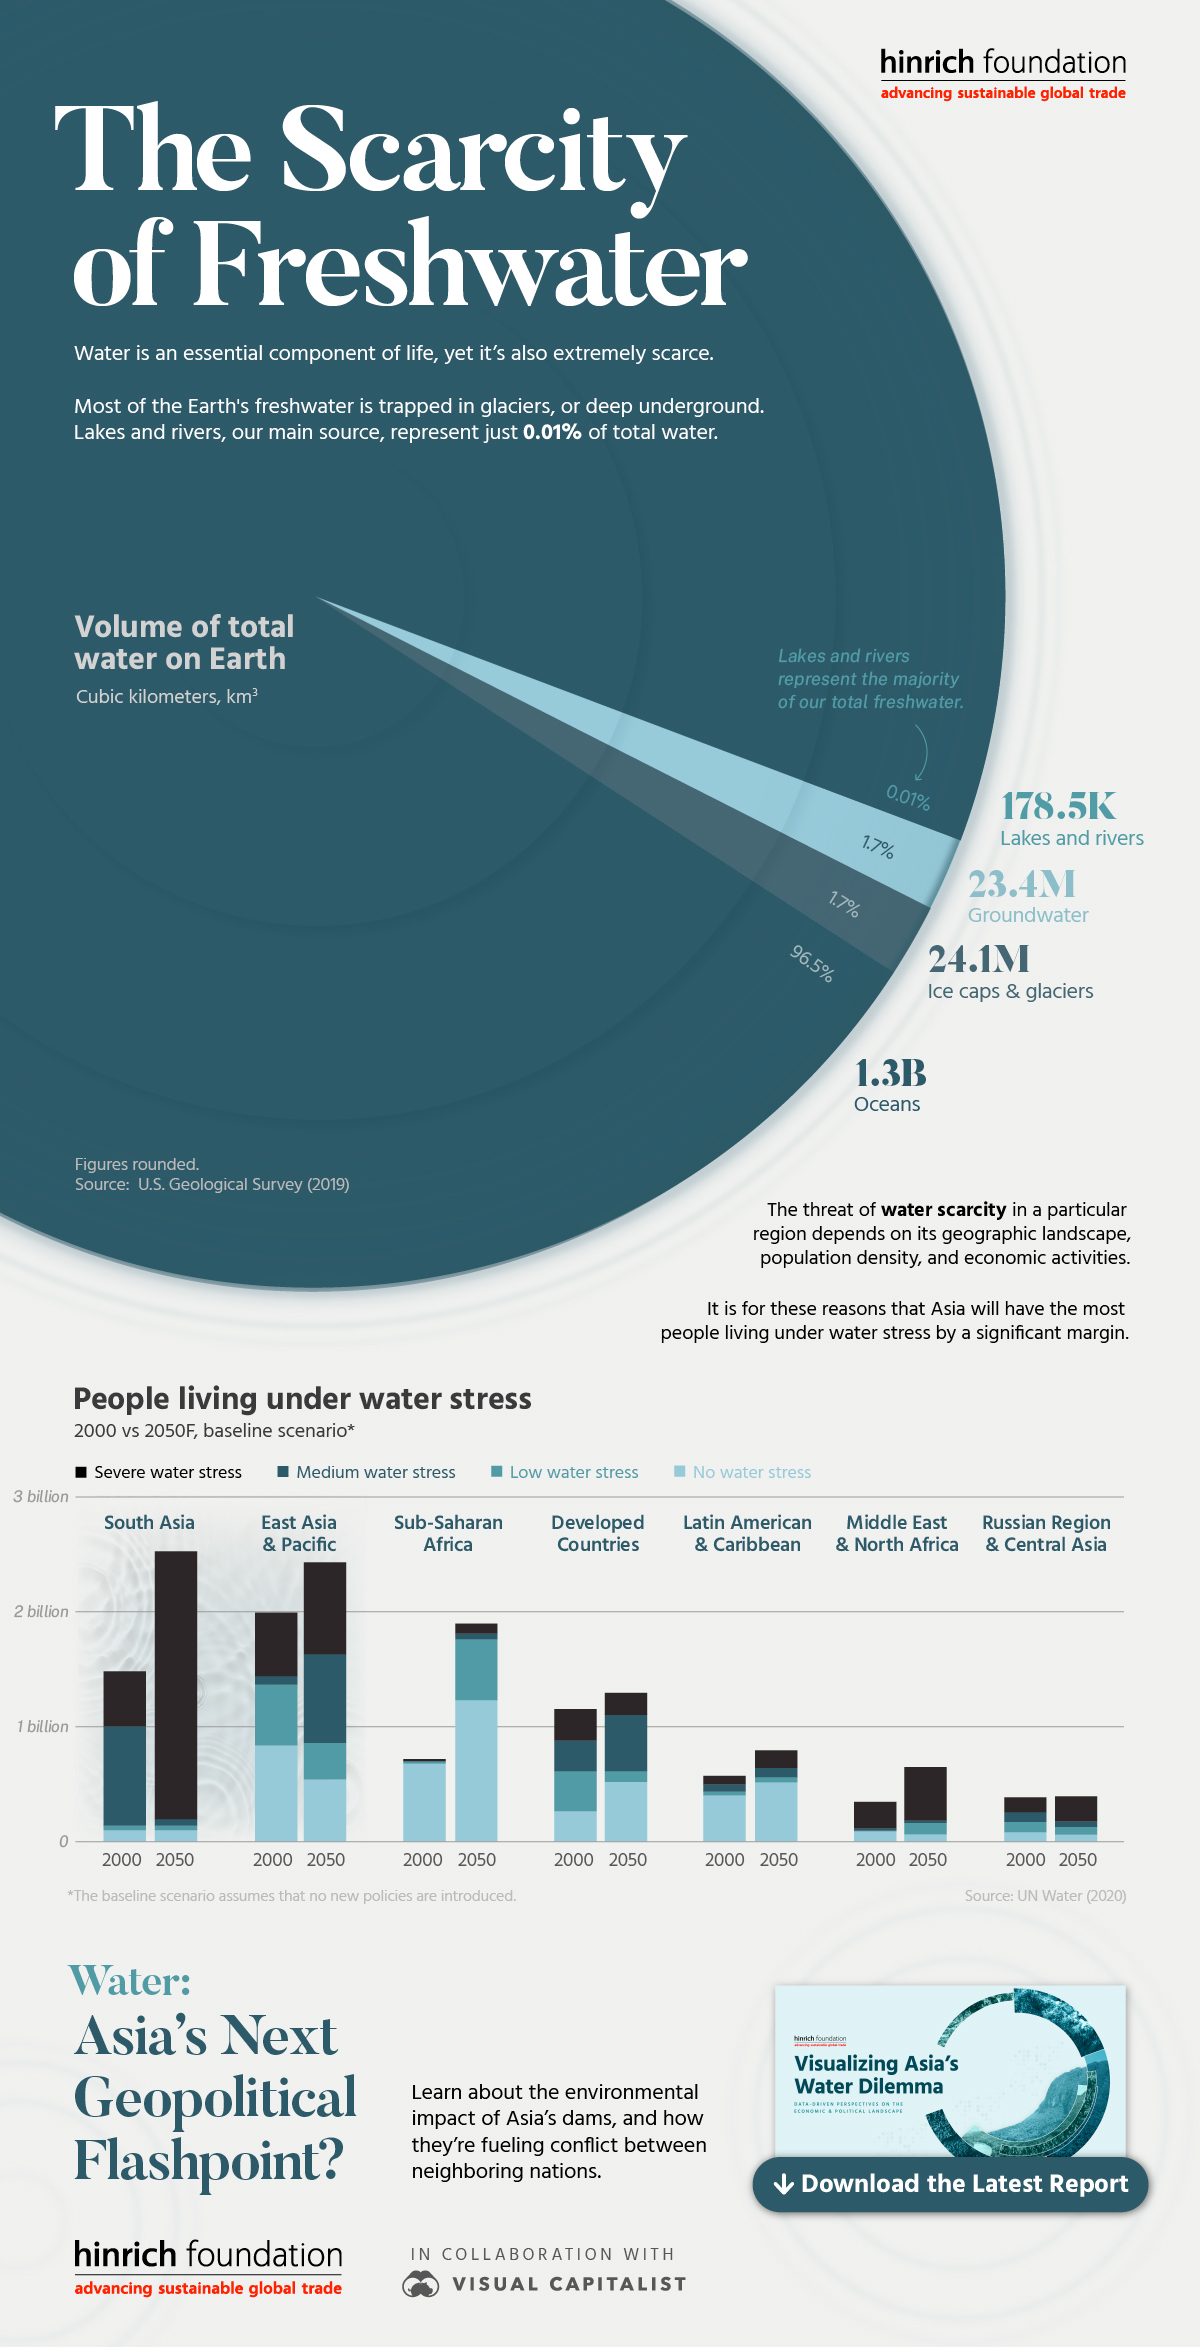
The Scarcity of Freshwater
Water is an essential component of life, enabling everything from food production to electricity generation. Given its ubiquity, it’s surprising to see how scarce water actually is.
For example, lakes and rivers supply the majority of our freshwater, yet they represent just 0.01% of the Earth’s total water resources.
This graphic from Hinrich Foundation introduces their latest free report, Visualizing Asia’s Water Dilemma, produced in partnership with Visual Capitalist.
This data-driven report provides a global overview of water scarcity, as well as a deep dive into the related geopolitical conflicts brewing throughout Asia.
The Total Volume of Water on Earth
The first visualization in this graphic breaks down all of the world’s water, based on estimates from the U.S. Geological Survey.
| Resource | Volume (cubic kilometers) | Percent of total water |
|---|---|---|
| Oceans | 1,338,000,000 | 96.5 |
| Ice caps & glaciers | 24,064,000 | 1.74 |
| Groundwater | 23,400,000 | 1.69 |
| Lakes and rivers | 178,520 | 0.01 |
When you consider the amount of water needed to produce everyday products, this isn’t very much at all. A smartphone, for example, has a water footprint of over 12,000 liters due to the pollutants from production that must be diluted.
To see a visual breakdown of the water footprint of everyday products, download the free report.
Asia Has the Most People Living Under Water Stress
The second visualization in this graphic outlines the UN’s forecasts for the number of people living under water stress by region, in 2000 and 2050.
Asia will lead by a very wide margin due to its geographic landscape, high population, and dense centers of economic activity.
Water: Asia’s Next Geopolitical Flashpoint?
Asia is home to a complex network of rivers that originate in the Tibetan Plateau, located within China’s borders. From there, these rivers deliver water to many of the world’s most populous countries, including India, Pakistan, and Vietnam.
This geographic reality, combined with unregulated dam building along major rivers, is leading to a growing number of disputes among neighboring countries.
For more analysis and infographics, download the free report Visualizing Asia’s Water Dilemma
-

 Green1 week ago
Ranking the Top 15 Countries by Carbon Tax Revenue
This graphic highlights France and Canada as the global leaders when it comes to generating carbon tax revenue.
-

 Green1 week ago
Ranked: The Countries With the Most Air Pollution in 2023
South Asian nations are the global hotspot for pollution. In this graphic, we rank the world’s most polluted countries according to IQAir.
-

 Environment2 weeks ago
Top Countries By Forest Growth Since 2001
One country is taking reforestation very seriously, registering more than 400,000 square km of forest growth in two decades.
-

 Green3 weeks ago
Ranked: Top Countries by Total Forest Loss Since 2001
The country with the most forest loss since 2001 lost as much forest cover as the next four countries combined.
-

 Markets2 months ago
The World’s Top Cocoa Producing Countries
Here are the largest cocoa producing countries globally—from Côte d’Ivoire to Brazil—as cocoa prices hit record highs.
-

 Environment2 months ago
Charted: Share of World Forests by Country
We visualize which countries have the biggest share of world forests by area—and while country size plays a factor, so too, does the environment.


-

 Mining1 week ago
Gold vs. S&P 500: Which Has Grown More Over Five Years?
-

 Markets2 weeks ago
Ranked: The Most Valuable Housing Markets in America
-

 Money2 weeks ago
Which States Have the Highest Minimum Wage in America?
-

 AI2 weeks ago
Ranked: Semiconductor Companies by Industry Revenue Share
-

 Markets2 weeks ago
Ranked: The World’s Top Flight Routes, by Revenue
-

 Countries2 weeks ago
Population Projections: The World’s 6 Largest Countries in 2075
-

 Markets2 weeks ago
The Top 10 States by Real GDP Growth in 2023
-

 Demographics2 weeks ago
The Smallest Gender Wage Gaps in OECD Countries