Agriculture
With California’s Rainy Season Over, How Full Are the State’s Reservoirs?
[Interactive] With California’s Rainy Season Over, How Full Are the State’s Reservoirs?
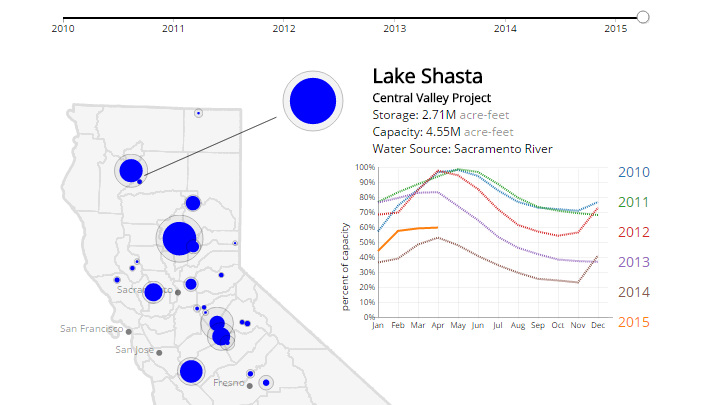
The Golden State is entering into the hot season, and it is historically at this time that its reservoirs are filled to the brim with precipitation and the melting snowpack from the Sierra Nevada mountains.
Residents were hoping that this would be the beginning of the end for the four-year drought. However, as this animated and interactive visualization timeline produced by The Lowdown shows, things are not looking good. It maps California’s 30 most important reservoirs and shows the pattern of water levels over the past five years. Click on any of these reservoirs above to see the related data.
Most reservoirs are at levels similar or worse to those in 2014, and the snowpack is at a record low. In fact, a statewide survey found the water content to be only 5% of the April 1 average.
Governor Jerry Brown has already took the unprecedented step of ordering mandatory rationing to try and reduce overall water usage by 25% by the end of year. However, as this economic blog points out, there is actually plenty of water to go around. It is simply an economic issue: water is seriously underpriced in California, which creates incentive to use more for lush green lawns, golf courses, and other amenities. Agriculture, which takes full advantage of underpriced water, accounts for 80% of water usage (but only 2% of economic activity).
Californians will have to pay more for their water in some shape or form. Either they will have to pay more per gallon, or they will have to pay the big economic price for a long drought and government interventions. Unless a miracle happens in the coming months, the choice will be even more dire.


Markets
The World’s Top Cocoa Producing Countries
Here are the largest cocoa producing countries globally—from Côte d’Ivoire to Brazil—as cocoa prices hit record highs.
The World’s Top Cocoa Producing Countries
This was originally posted on our Voronoi app. Download the app for free on iOS or Android and discover incredible data-driven charts from a variety of trusted sources.
West Africa is home to the largest cocoa producing countries worldwide, with 3.9 million tonnes of production in 2022.
In fact, there are about one million farmers in Côte d’Ivoire supplying cocoa to key customers such as Nestlé, Mars, and Hershey. But the massive influence of this industry has led to significant forest loss to plant cocoa trees.
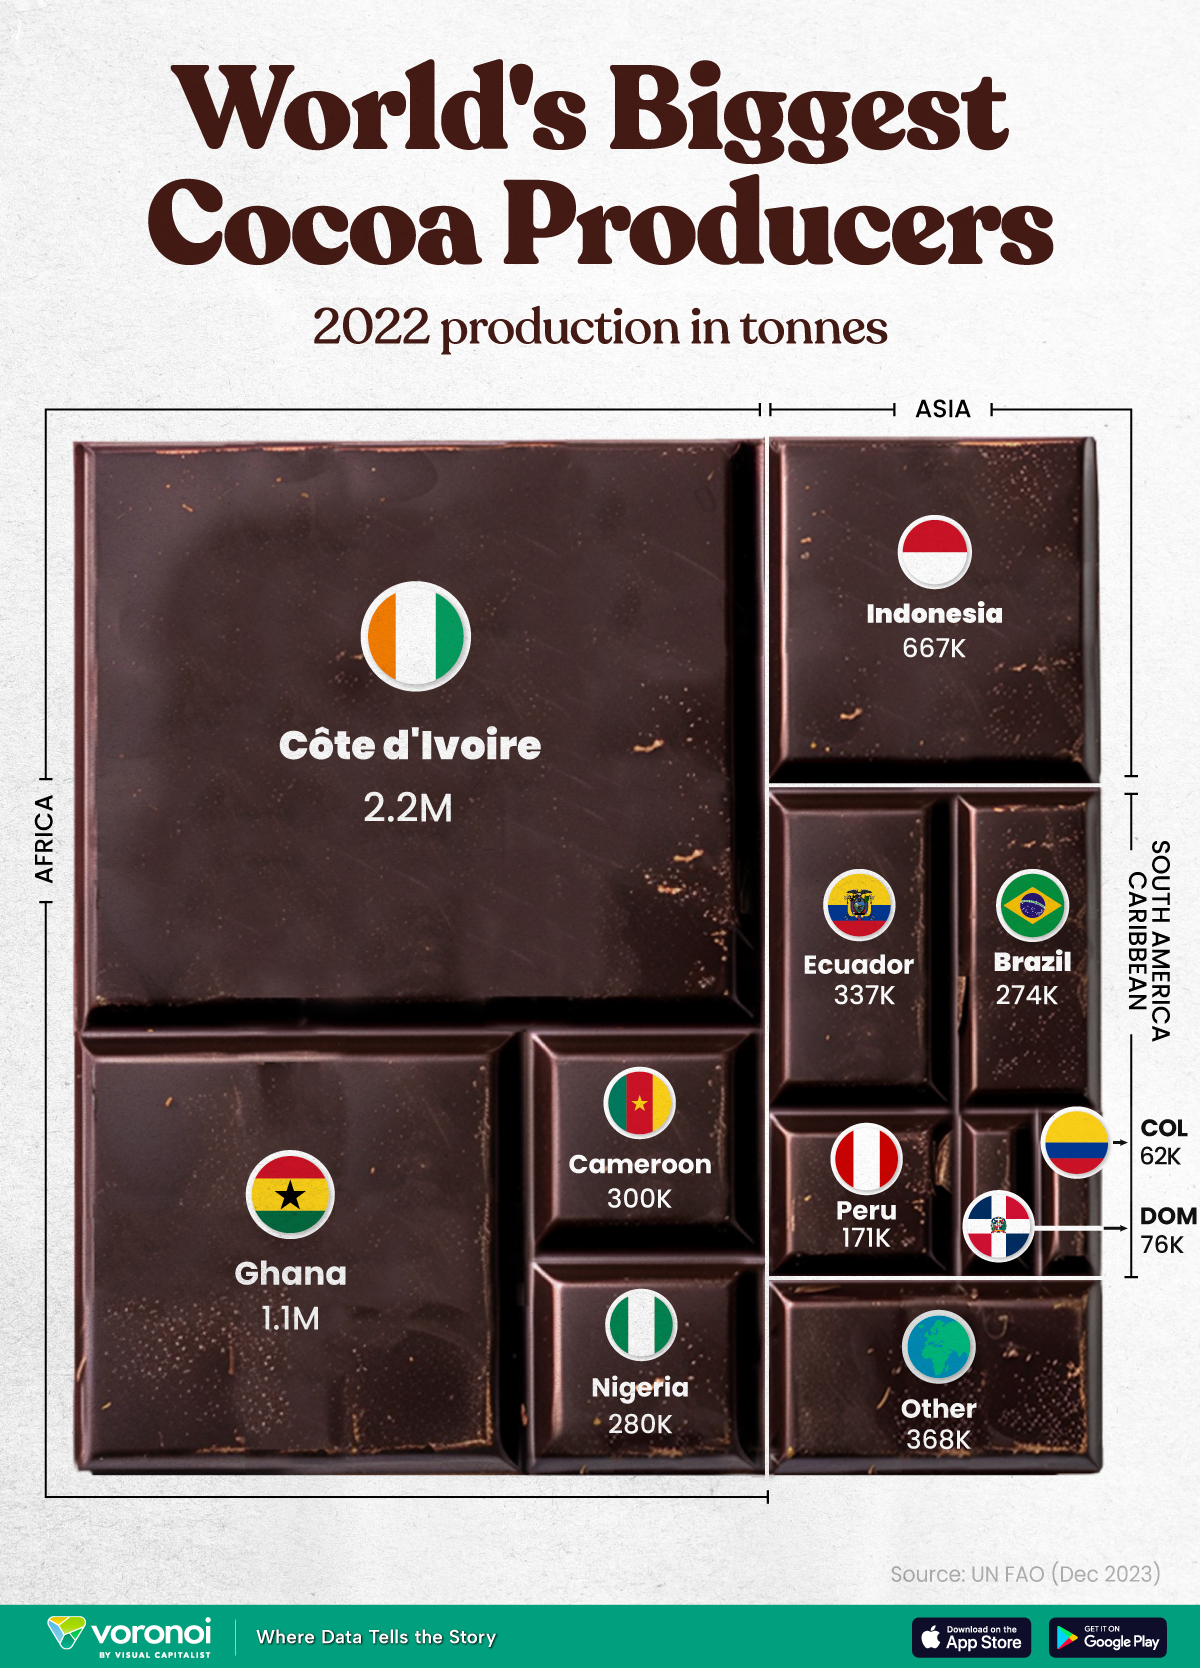
This graphic shows the leading producers of cocoa, based on data from the UN FAO.
Global Hotspots for Cocoa Production
Below, we break down the top cocoa producing countries as of 2022:
| Country | 2022 Production, Tonnes |
|---|---|
| 🇨🇮 Côte d'Ivoire | 2.2M |
| 🇬🇭 Ghana | 1.1M |
| 🇮🇩 Indonesia | 667K |
| 🇪🇨 Ecuador | 337K |
| 🇨🇲 Cameroon | 300K |
| 🇳🇬 Nigeria | 280K |
| 🇧🇷 Brazil | 274K |
| 🇵🇪 Peru | 171K |
| 🇩🇴 Dominican Republic | 76K |
| 🌍 Other | 386K |
With 2.2 million tonnes of cocoa in 2022, Côte d’Ivoire is the world’s largest producer, accounting for a third of the global total.
For many reasons, the cocoa trade in Côte d’Ivoire and Western Africa has been controversial. Often, farmers make about 5% of the retail price of a chocolate bar, and earn $1.20 each day. Adding to this, roughly a third of cocoa farms operate on forests that are meant to be protected.
As the third largest producer, Indonesia produced 667,000 tonnes of cocoa with the U.S., Malaysia, and Singapore as major importers. Overall, small-scale farmers produce 95% of cocoa in the country, but face several challenges such as low pay and unwanted impacts from climate change. Alongside aging trees in the country, these setbacks have led productivity to decline.
In South America, major producers include Ecuador and Brazil. In the early 1900s, Ecuador was the world’s largest cocoa producing country, however shifts in the global marketplace and crop disease led its position to fall. Today, the country is most known for its high-grade single-origin chocolate, with farms seen across the Amazon rainforest.
Altogether, global cocoa production reached 6.5 million tonnes, supported by strong demand. On average, the market has grown 3% annually over the last several decades.

-

 Green1 week ago
Ranked: The Countries With the Most Air Pollution in 2023
-

 Automotive2 weeks ago
Almost Every EV Stock is Down After Q1 2024
-

 AI2 weeks ago
The Stock Performance of U.S. Chipmakers So Far in 2024
-

 Markets2 weeks ago
Charted: Big Four Market Share by S&P 500 Audits
-

 Real Estate2 weeks ago
Ranked: The Most Valuable Housing Markets in America
-

 Money2 weeks ago
Which States Have the Highest Minimum Wage in America?
-

 AI2 weeks ago
Ranked: Semiconductor Companies by Industry Revenue Share
-

 Travel2 weeks ago
Ranked: The World’s Top Flight Routes, by Revenue