Misc
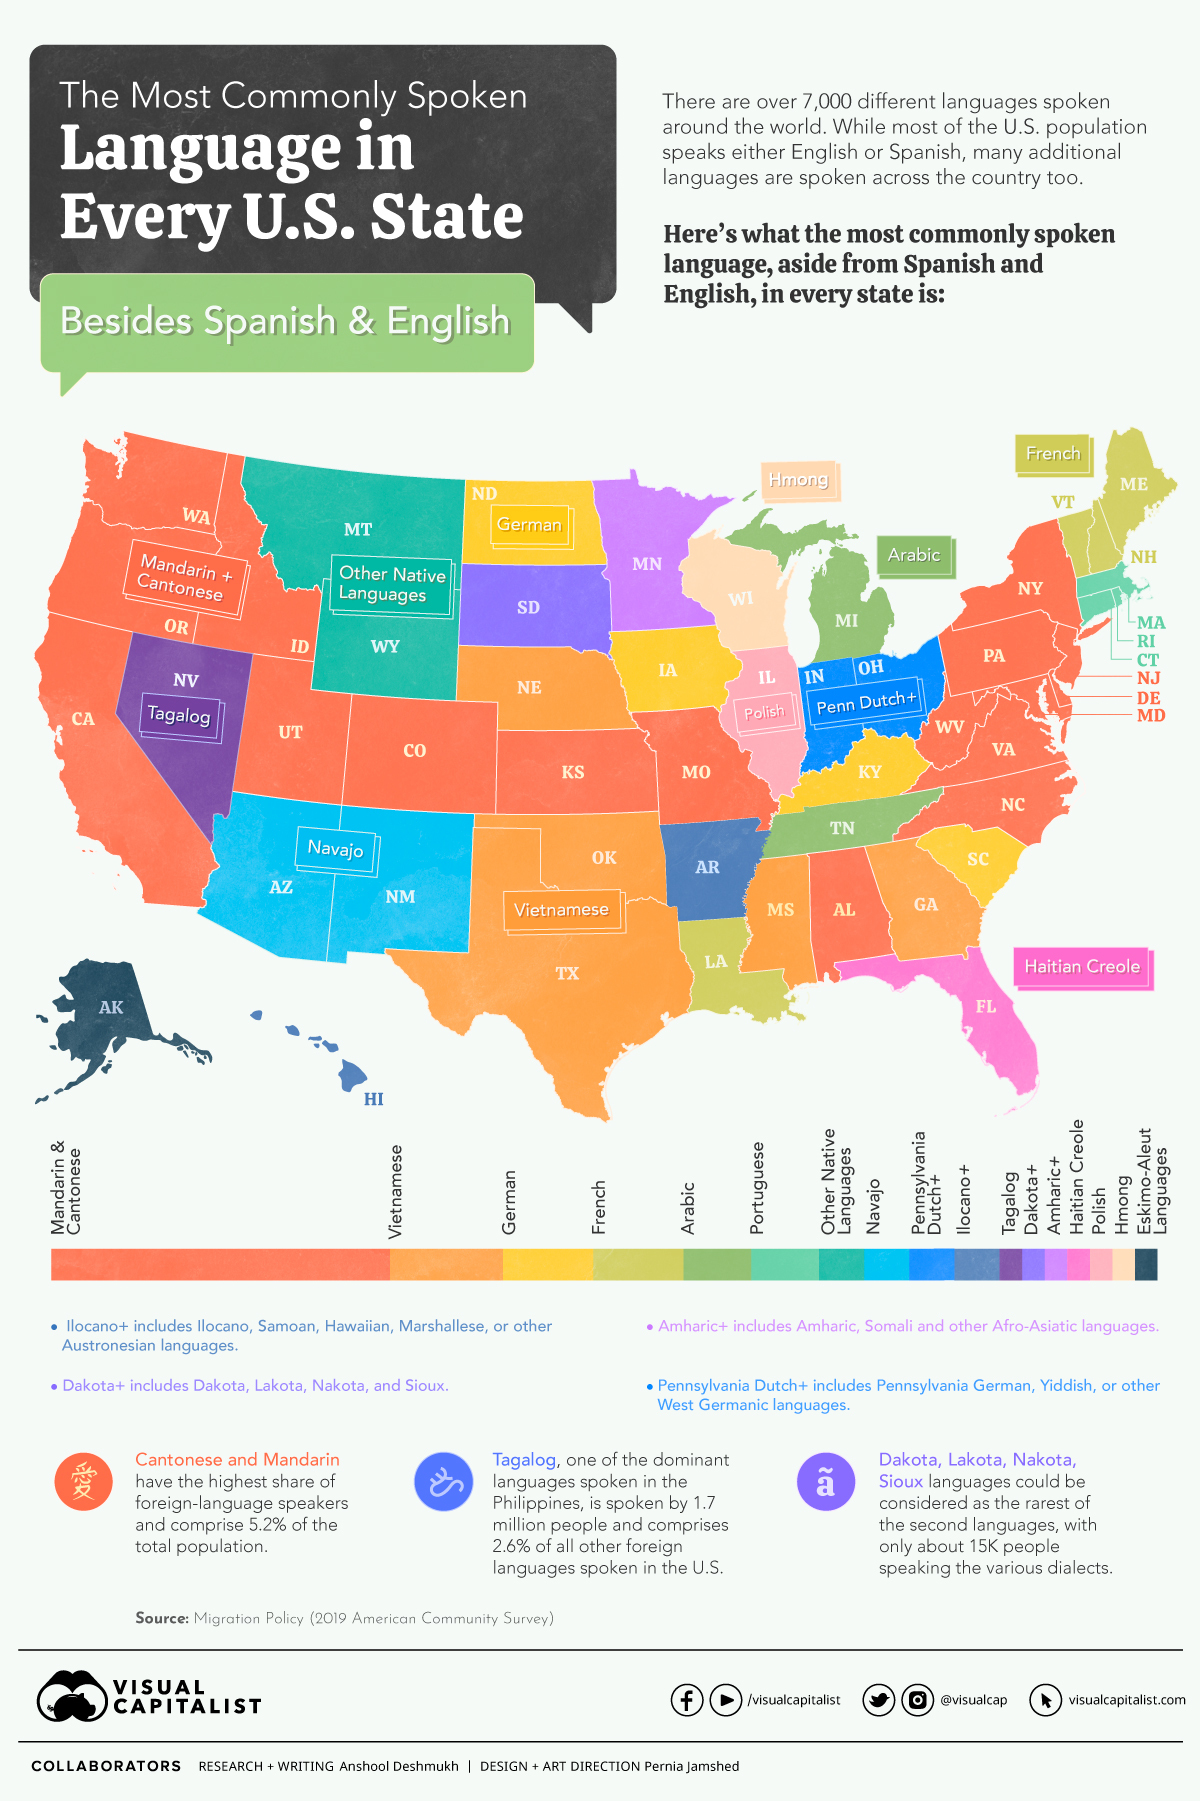
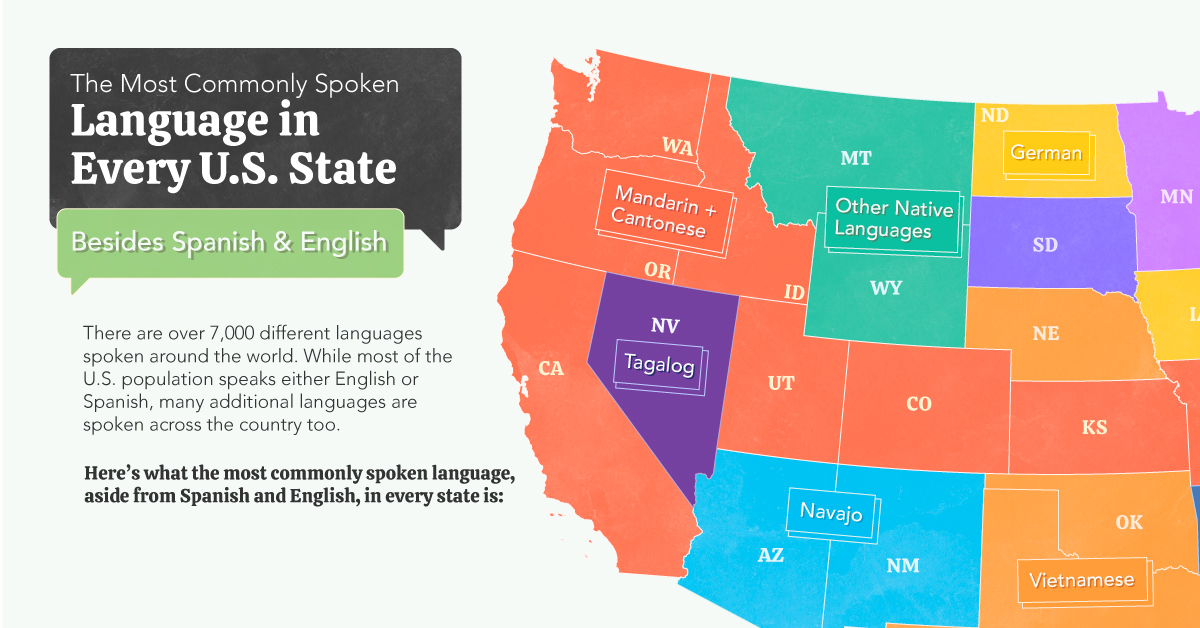
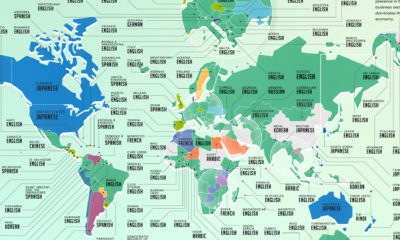
The Most Commonly Spoken Language in Every U.S. State (Besides English and Spanish)


The Most Common Spoken Household Languages
We typically operate under the assumption that most Americans speak either English or Spanish. Though this is true in the broadest sense, the U.S. is a culturally diverse country, home to a plethora of languages.
The U.S. Census Bureau’s American Community Survey (ACS) annually asks more than 1 million Americans questions about their lives, families, and backgrounds. One question asks respondents what language they mainly speak in their homes.
Migration Policy has used this data (while excluding English and Spanish) to leave us with the next-most-frequently spoken languages at home in each state.
Non-English Languages in the U.S.
In 2019, approximately 78% (241 million) of all 308.8 million people ages five and older reported speaking only English at home regardless of their nativity. The remaining 22% (67.8 million) reported speaking a language other than English at home.
Based on this data, Mandarin and Cantonese were the most common non-English, non-Spanish languages spoken in the U.S., with more than 3.4 million speakers across the country.
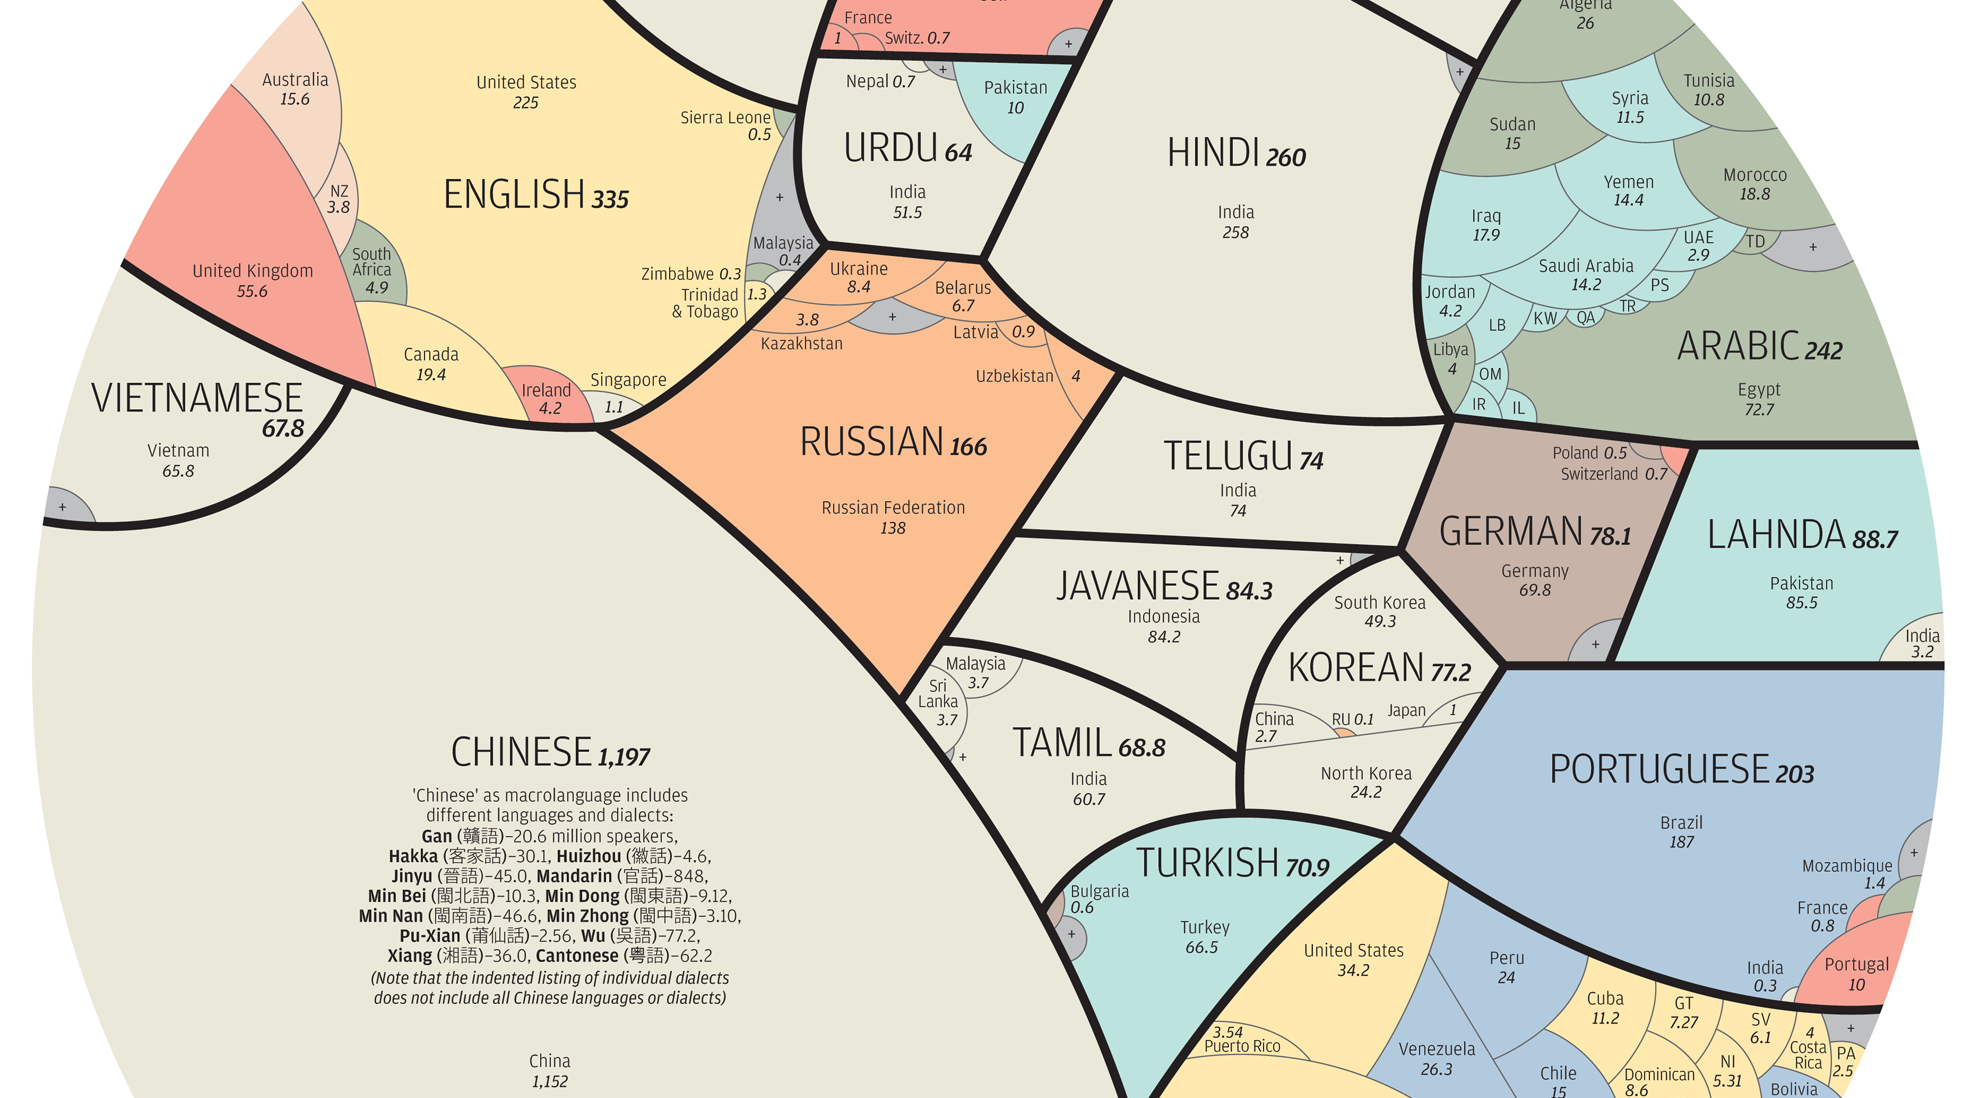
Here is a list of the most common languages spoken at home in the U.S., outside of English:
| Language | Population Estimate | Share of Foreign Language Speakers |
|---|---|---|
| Spanish | 41,757,000 | 61.6% |
| Cantonese and Mandarin | 3,495,000 | 5.2% |
| Tagalog | 1,764,000 | 2.6% |
| Vietnamese | 1,571,000 | 2.3% |
| Arabic | 1,260,000 | 1.9% |
| French and Louisiana French | 1,172,000 | 1.7% |
| Korean | 1,075,000 | 1.6% |
| Russian | 941,000 | 1.4% |
| Haitian Creole | 925,000 | 1.4% |
| German | 895,000 | 1.3% |
| Hindi | 893,000 | 1.3% |
| Portuguese | 846,000 | 1.2% |
| Afro-Asiatic Languages | 590,000 | 0.9% |
| West African Languages | 589,000 | 0.9% |
| Indo-European Languages | 576,000 | 0.8% |
| West Germanic Languages | 560,000 | 0.8% |
| Italian | 540,000 | 0.8% |
Tagalog is the second most commonly spoken language in American households (after English/Spanish) with 1.7 million speakers, even though it only reaches top spot in Nevada. Unsurprisingly, Louisiana and states bordering eastern Canada have a healthy number of French speakers.
Further analysis of these common languages reveals a fascinating story. Here’s a breakdown of the top 5 most commonly spoken second languages (excluding English and Spanish), and the states where they’re spoken.
1. Cantonese and Mandarin
Estimated number of speakers nationally: 3,495,000
Number of states where it’s the most common: 17
States that most commonly speak the language: California, Washington, Oregon, Idaho, Utah, Colorado, Kansas, Missouri, Alabama, New York, Pennsylvania, Virginia, West Virginia, North Carolina, New Jersey, Delaware and Maryland.
Chinese immigrants have been coming to America in large numbers since the mid-19th century, when the California Gold Rush compelled them to cross the Pacific Ocean. Today, there are over 5 million Chinese Americans across the country.
2. Tagalog
Estimated number of speakers nationally: 1,764,000
Number of states where it’s the most common: 1
States that most commonly speak the language: Nevada
Immigrants from the Philippines started coming to America in large numbers by the turn of the 19th century, but it wasn’t until 1965 that both skilled and educated workers came by the thousands. Today, there are over 4 million Filipino Americans.
3. Vietnamese
Estimated number of speakers nationally: 1,571,000
Number of states where it’s the most common: 5
States that most commonly speak the language: Nebraska, Oklahoma, Texas, Mississippi and Georgia.
South Vietnamese immigration to the U.S. began right after the Vietnam War ended in 1975, and more Vietnamese people have been arriving ever since. Today, over half of all Vietnamese-Americans live in either California or Texas.
4. Arabic
Estimated number of speakers nationally: 1,260,000
Number of states where it’s the most common: 2
States that most commonly speak the language: Michigan and Tennessee
Michigan alone has over 140,000 Arabic speakers. California has over 190,000 speakers. Pew Research Center noted that Arabic is the fastest-growing language in the U.S., with speakers growing by 29% from 2010 to 2014.
5. French
Estimated number of speakers nationally: 1,172,000
Number of states where it’s the most common: 4
States that most commonly speak the language: Louisiana, Maine, Vermont and New Hampshire.
After the Louisiana Purchase, French evolved from its original form, creating Louisiana French which also borrows words from English, Spanish, Native American, and African languages. To this day, it’s still spoken by around 175,000 people in Louisiana and Texas.
The United States: A Multilingual Country
Although English, in all its diversity, is unquestionably the country’s dominant national language, the U.S. has always had a complex multilingual history. Long before European settlers colonized North and South America, thousands of indigenous languages thrived from coast to coast. Today, some Indigenous languages are making a comeback as many states acknowledge their importance in the history and culture of the country.
With each new wave of immigrants residing in the country from every part of the globe, the linguistic and cultural diversity of the United States is growing.
The U.S. has one of the largest Chinese populations outside China, a demographic shift that may increase in the coming years. Spanish is now the most popular second language of the country.
America is home to the largest population of English speakers in the world, but bilingualism has been on the rise in the country for decades – a trend that shows no signs of letting up.


United States
Charted: What Southeast Asia Thinks About China & the U.S.
A significant share of respondents from an ASEAN-focused survey are not happy about rising American and Chinese influence in the region.
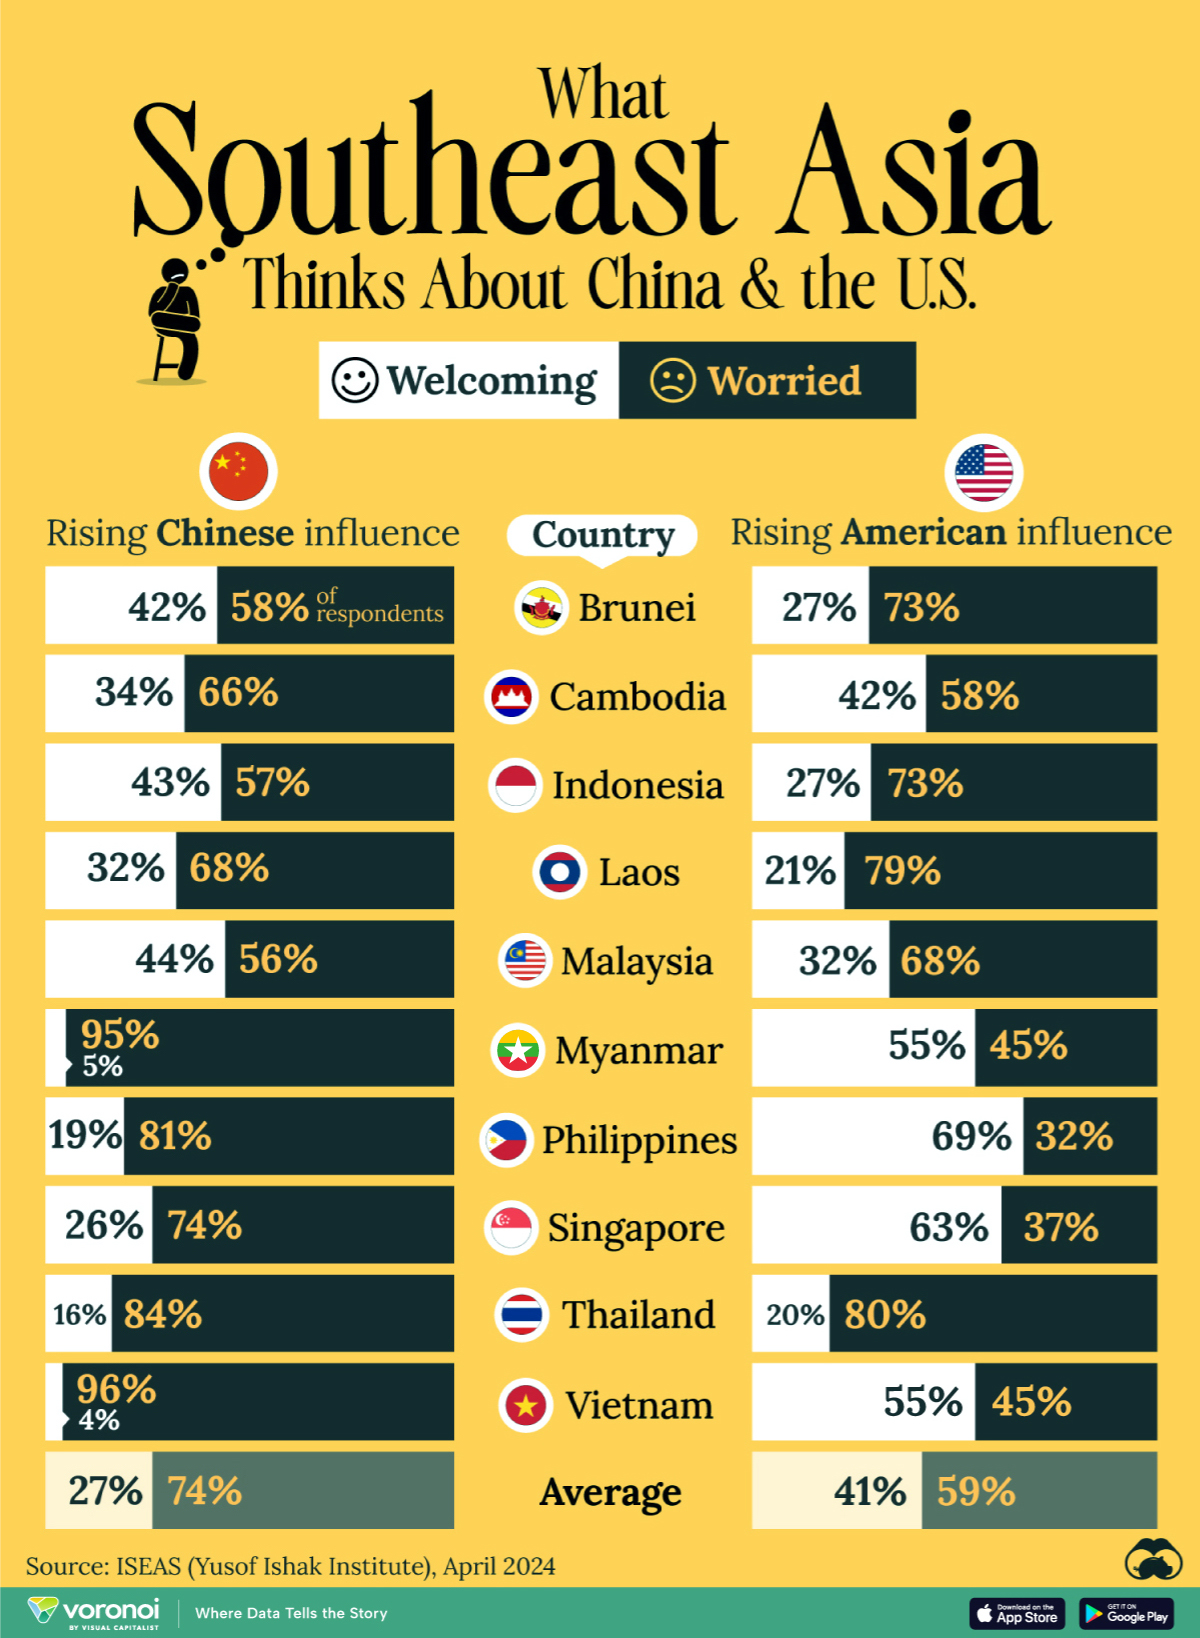
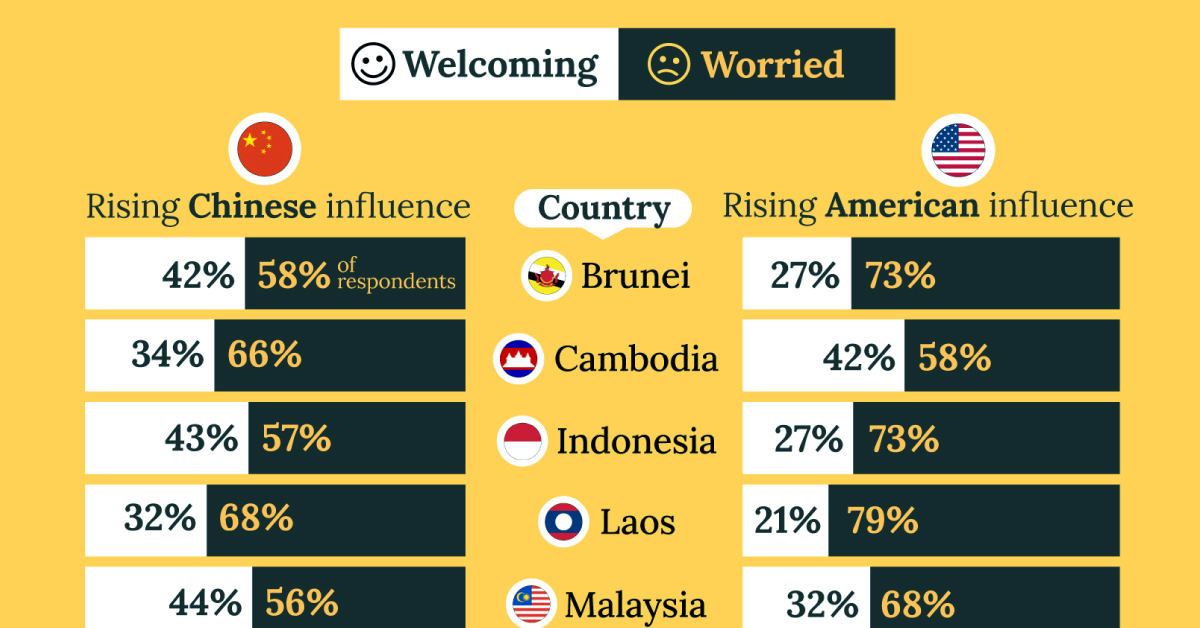
What Southeast Asia Thinks About China & the U.S.
This was originally posted on our Voronoi app. Download the app for free on iOS or Android and discover incredible data-driven charts from a variety of trusted sources.
This chart visualizes the results of a 2024 survey conducted by the ASEAN Studies Centre at the ISEAS-Yusof Ishak Institute. Nearly 2,000 respondents were asked if they were worried or welcoming of rising Chinese and American geopolitical influence in their country.
The countries surveyed all belong to the Association of Southeast Asian Nations (ASEAN), a political and economic union of 10 states in Southeast Asia.
Feelings Towards China
On average, a significant share of respondents from all 10 countries are worried about rising influence from both the U.S. and China.
However, overall skepticism is higher for China, at 74% (versus 59% for U.S.).
| Country | Worried About Growing 🇨🇳 Influence | Welcome Growing 🇨🇳 Influence |
|---|---|---|
| 🇧🇳 Brunei | 58% | 42% |
| 🇰🇭 Cambodia | 66% | 34% |
| 🇮🇩 Indonesia | 57% | 43% |
| 🇱🇦 Laos | 68% | 32% |
| 🇲🇾 Malaysia | 56% | 44% |
| 🇲🇲 Myanmar | 95% | 5% |
| 🇵🇭 Philippines | 81% | 19% |
| 🇸🇬 Singapore | 74% | 26% |
| 🇹🇭 Thailand | 84% | 16% |
| 🇻🇳 Vietnam | 96% | 4% |
| Average | 74% | 27% |
The recently-cooled but still active territorial concerns over the South China Sea may play a significant role in these responses, especially in countries which are also claimants over the sea.
For example, in Vietnam over 95% of respondents said they were worried about China’s growing influence.
Feelings Towards America
Conversely, rising American influence is welcomed in two countries with competing claims in the South China Sea, the Philippines (69%) and Vietnam (55%).
| Country | Worried About Growing 🇺🇸 Influence | Welcome Growing 🇺🇸 Influence |
|---|---|---|
| 🇧🇳 Brunei | 73% | 27% |
| 🇰🇭 Cambodia | 58% | 42% |
| 🇮🇩 Indonesia | 73% | 27% |
| 🇱🇦 Laos | 79% | 21% |
| 🇲🇾 Malaysia | 68% | 32% |
| 🇲🇲 Myanmar | 45% | 55% |
| 🇵🇭 Philippines | 32% | 69% |
| 🇸🇬 Singapore | 37% | 63% |
| 🇹🇭 Thailand | 80% | 20% |
| 🇻🇳 Vietnam | 45% | 55% |
| Average | 59% | 41% |
Despite this, on a regional average, more respondents worry about growing American influence (59%) than they welcome it (41%).
Interestingly, it seems almost every ASEAN nation has a clear preference for one superpower over the other.
The only exception is Thailand, where those surveyed were not a fan of either option, with 84% worried about China, and 80% worried about the U.S.

-

 Culture6 days ago
The World’s Top Media Franchises by All-Time Revenue
-

 Science2 weeks ago
Visualizing the Average Lifespans of Mammals
-

 Brands2 weeks ago
How Tech Logos Have Evolved Over Time
-

 Energy2 weeks ago
Ranked: The Top 10 EV Battery Manufacturers in 2023
-

 Countries2 weeks ago
Countries With the Largest Happiness Gains Since 2010
-

 Economy2 weeks ago
VC+: Get Our Key Takeaways From the IMF’s World Economic Outlook
-

 Demographics1 week ago
The Countries That Have Become Sadder Since 2010
-

 Money1 week ago
Charted: Who Has Savings in This Economy?