Globalization
The Top 10 Biggest Companies in Russia
The Top 10 Biggest Companies in Russia
From 1922–1991, the Soviet Union (USSR) was not only the world’s largest country, but also one of its most populated, influential, and powerful.
Today, modern Russia still holds all of those distinctions. Though no longer a designated superpower, the Russian Federation has recovered from the fall of the Soviet Union and has become the world’s 11th-largest economy.
Even after being expelled from the G7 over its annexation of Crimea, Russia’s membership as one of the principal emerging economies in BRICS (alongside Brazil, India, China, and South Africa), the G20, and the United Nations Security Council solidifies its important position in the modern world.
What industries and companies drive the modern Russian state? Here we put the spotlight on the top 10 biggest companies in Russia, using data from Companies Market Cap.
What Are the Biggest Public Companies in Russia?
As a resource-rich country and previously a socialist state, it’s no surprise that many of Russia’s biggest companies are current or former state-owned corporations.
Eight out of the biggest companies in Russia by market value are in natural resources, and four are current state-owned enterprises.
Here are Russia’s biggest public companies by market capitalization in November 2021:
| Top 10 Russian Companies | Category | Market Cap (USD) |
|---|---|---|
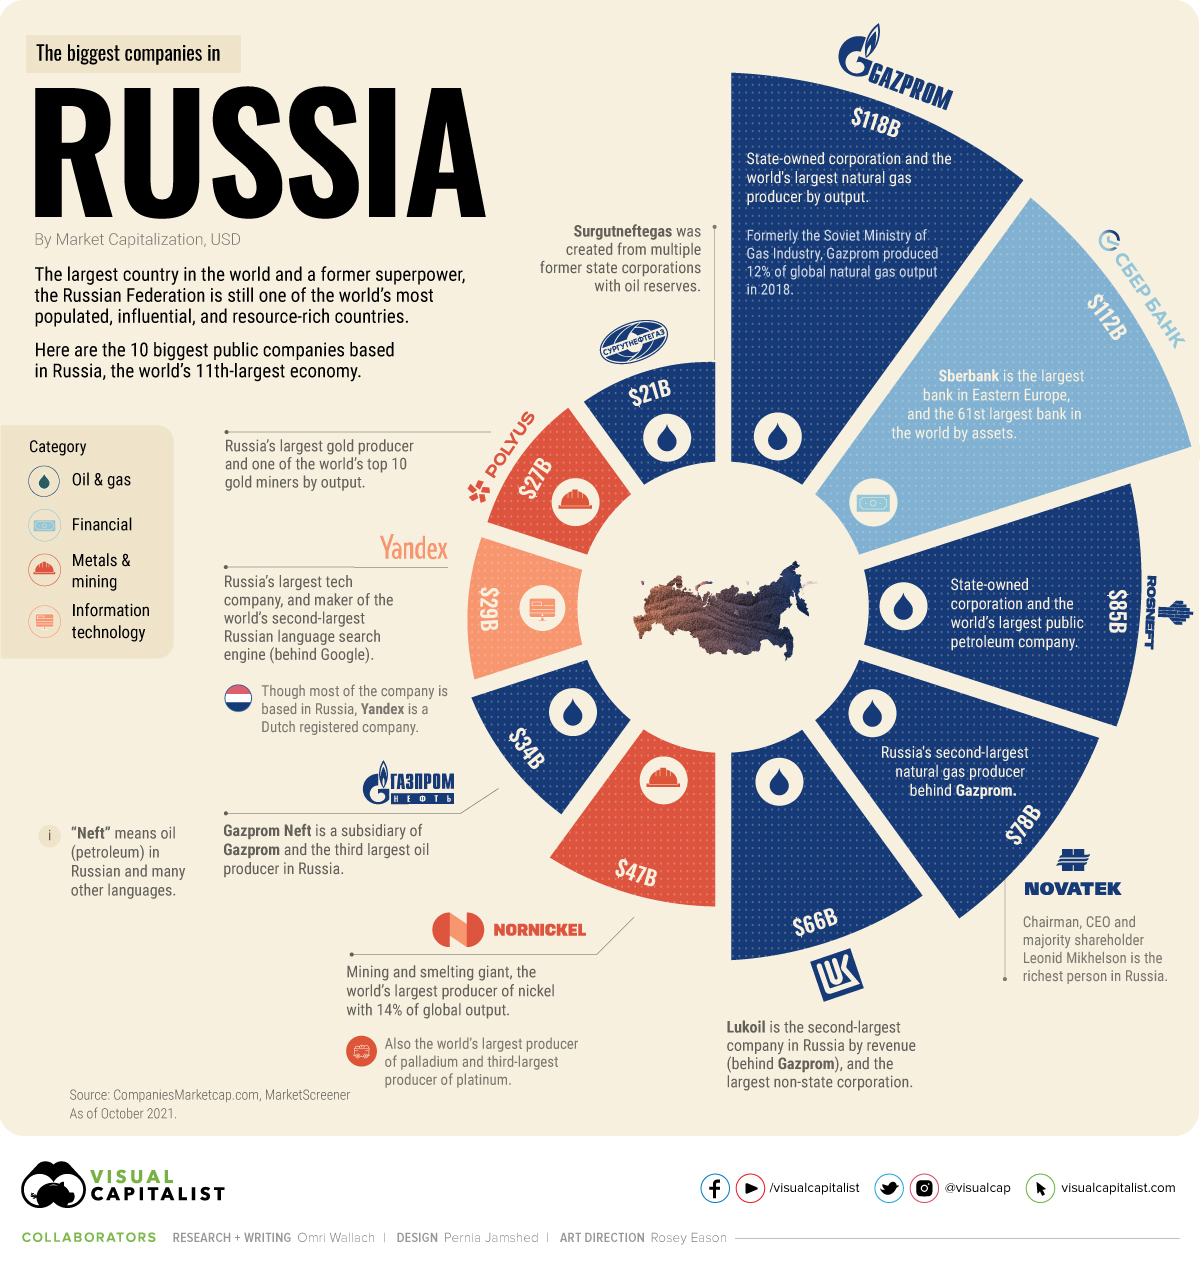
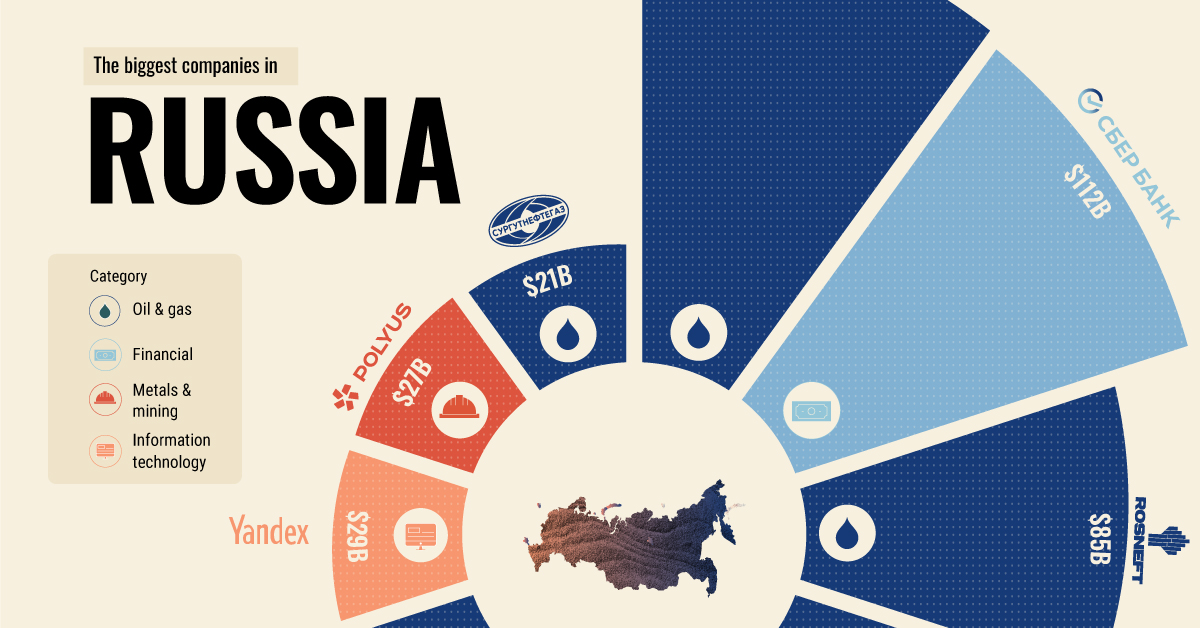
| Gazprom | Oil and Gas | $118B |
| Sberbank | Financial | $112B |
| Rosneft | Oil and Gas | $85B |
| Novatek | Oil and Gas | $78B |
| Lukoil | Oil and Gas | $66B |
| Nornickel | Metals & Mining | $47B |
| Gazprom Neft | Oil and Gas | $34B |
| Yandex | Information Technology | $29B |
| Polyus | Metals & Mining | $27B |
| Surgutneftegas | Oil and Gas | $21B |
The two biggest companies in Russia, gas producer Gazprom (formerly the Soviet Ministry of Gas Industry) and banking and financial provider Sberbank, have consistently been the largest enterprises in the country.
In November, Gazprom was bigger with a market cap of $118 billion compared to Sberbank’s $112 billion, though they constantly switch places over time.
But other than Sberbank and tech provider Yandex, the top 10 was composed entirely of oil, gas and mining companies.
Russia’s Importance to Global Natural Resources
Oil and gas specifically made up six out of the 10 biggest companies in Russia. Most like Rosneft, Gazprom Neft, and Lukoil are in oil—the Russian word “neft” means oil or petroleum in Russian and many other languages).
In addition to the two mining companies that cracked the top 10, the biggest companies in Russia highlight the country’s relative importance to global resource sectors. Many of the top 10 companies in Russia are the largest (or amongst the largest) producers of natural resources in the world:
- Gazprom: The largest natural gas company in the world by output, producing 12% of global natural gas output in 2018.
- Rosneft: The world’s largest public oil producer.
- Nornickel: The world’s largest producer of nickel (14% of global output), palladium, and third-largest of platinum.
- Polyus: The world’s third-largest gold producer by output.
- Sberbank: The largest bank in Eastern Europe (and 61st in the world).
Overall, Russia’s vast landscape is estimated to contain over 30% of all natural resources in the world. Factor in a powerful financial sector and the world’s sixth-largest labor force at 70 million strong, and it’s clear to see why the country’s influence is so widespread.
As global powers begin to pledge greater commitment to clean energy, however, Russian companies also find themselves navigating transitional demand and pledging support for green projects.
What other companies or industries do you associate with Russia?


Politics
Charted: How Much Do Countries Trust the United Nations?
Which countries trust the United Nations to do the right thing the most, and the least?
How Much Do Countries Trust the United Nations?
This was originally posted on our Voronoi app. Download the app for free on iOS or Android and discover incredible data-driven charts from a variety of trusted sources.
Do you trust the United Nations (UN) in carrying out its objectives of maintaining peace and security, protecting human rights, and upholding international law?
Survey results from Edelman’s 2024 Trust Barometer Global Report show that some countries’ citizens believe strongly in the UN to “do the right thing,” while others are less trusting.
Ranked: 28 Countries Trust Levels in the United Nations in 2024
To gauge trust in the United Nations, Edelman surveyed more than 32,000 respondents between 28 countries in November 2023. Each country sample of 1,150 people is statistically significant and representative.
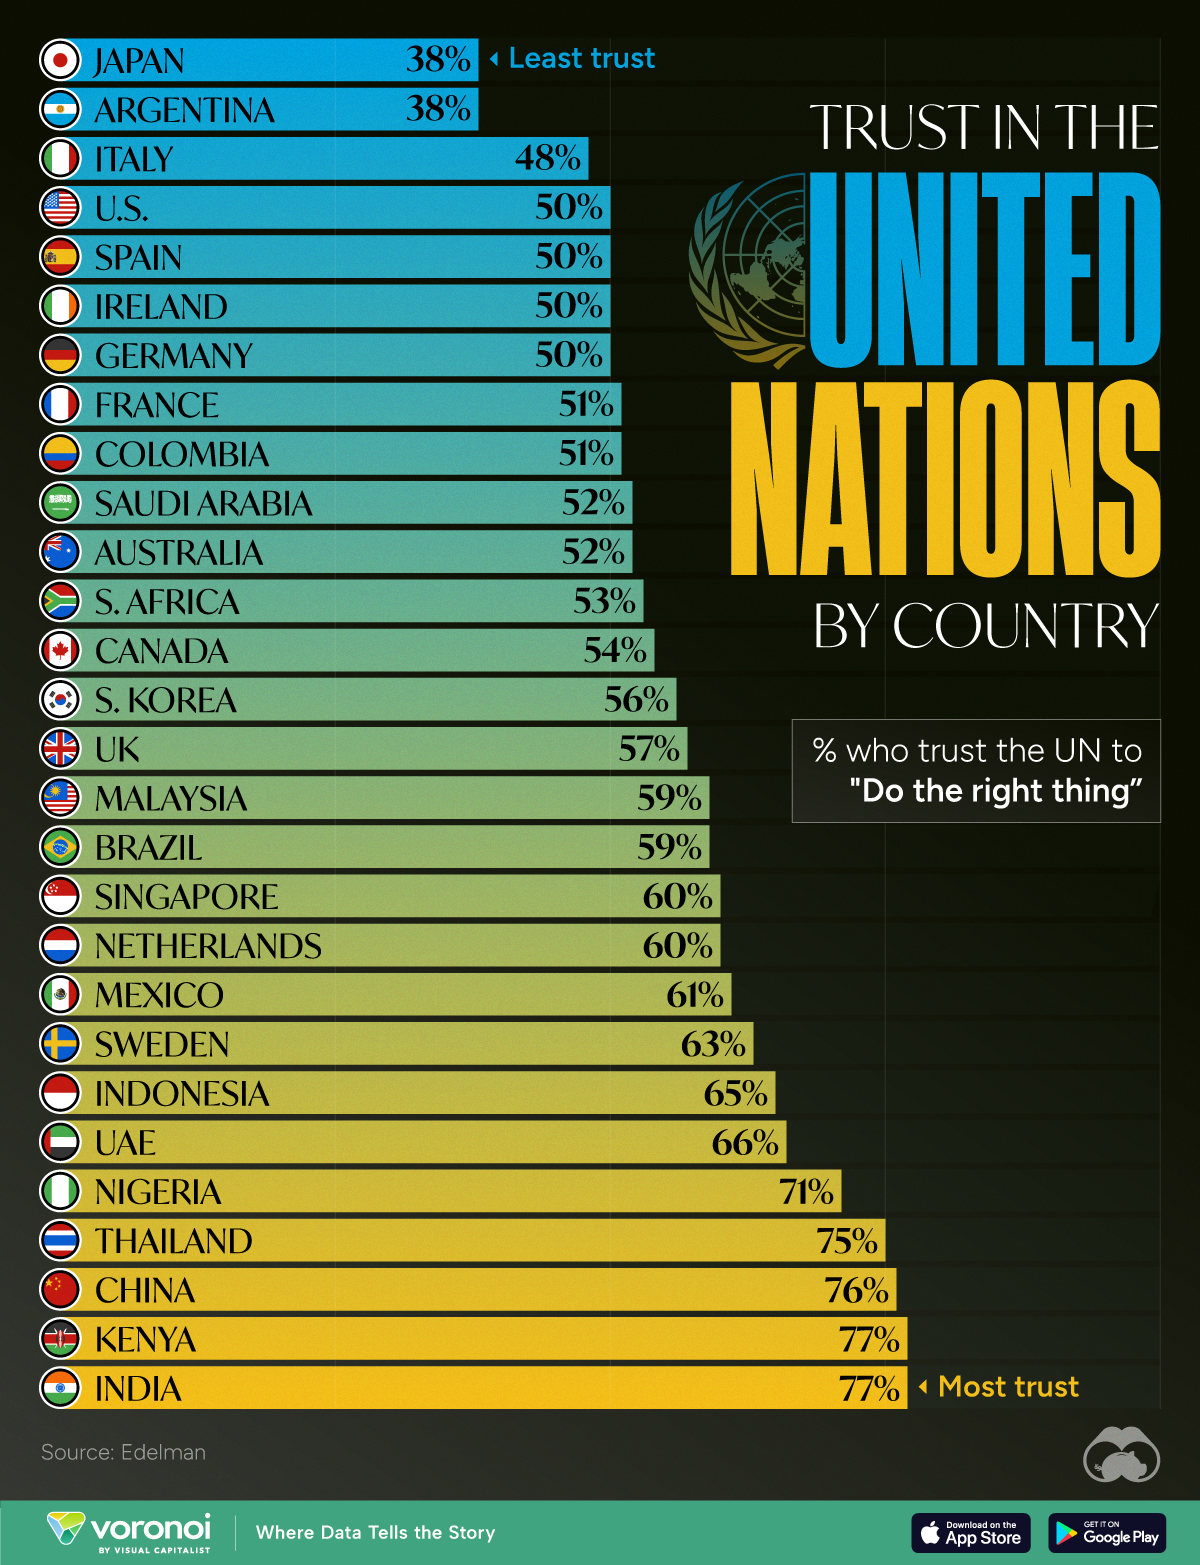
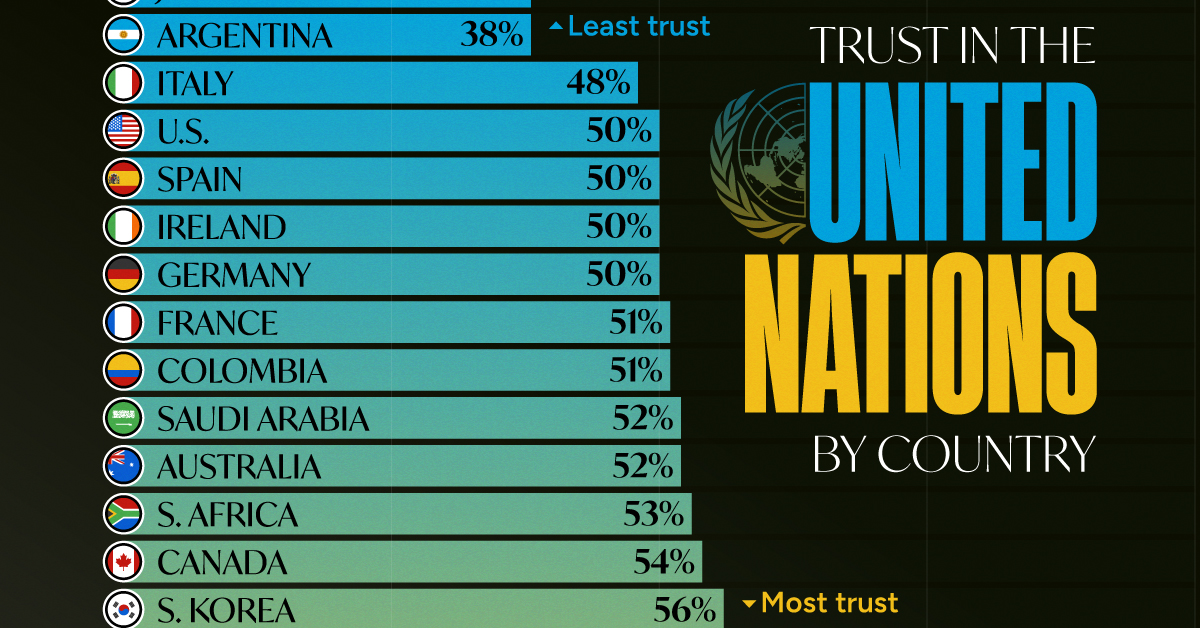
According to the results, respondents from Japan and Argentina had the least amount of trust in the UN when it came to “doing the right thing.”
| Country | % who trust the UN to "Do the right thing" |
|---|---|
| 🇯🇵 Japan | 38% |
| 🇦🇷 Argentina | 38% |
| 🇮🇹 Italy | 48% |
| 🇺🇸 U.S. | 50% |
| 🇪🇸 Spain | 50% |
| 🇮🇪 Ireland | 50% |
| 🇩🇪 Germany | 50% |
| 🇫🇷 France | 51% |
| 🇨🇴 Colombia | 51% |
| 🇸🇦 Saudi Arabia | 52% |
| 🇦🇺 Australia | 52% |
| 🇿🇦 South Africa | 53% |
| 🇨🇦 Canada | 54% |
| 🇰🇷 South Korea | 56% |
| 🇬🇧 UK | 57% |
| 🇲🇾 Malaysia | 59% |
| 🇧🇷 Brazil | 59% |
| 🇸🇬 Singapore | 60% |
| 🇳🇱 Netherlands | 60% |
| 🇲🇽 Mexico | 61% |
| 🇸🇪 Sweden | 63% |
| 🇮🇩 Indonesia | 65% |
| 🇦🇪 UAE | 66% |
| 🇳🇬 Nigeria | 71% |
| 🇹🇭 Thailand | 75% |
| 🇨🇳 China | 76% |
| 🇰🇪 Kenya | 77% |
| 🇮🇳 India | 77% |
Just 38% of Japanese and Argentinian people had faith in the UN, by far the lowest levels of trust. Only one other country was below the 50% trust mark: Italy at 48%.
Many major economies and G7 countries had trust levels hovering between 50–60%, including the U.S. and Germany at 50% and the UK at 57%.
Meanwhile, India and Kenya had the highest levels of trust in the UN at 77%, with China right behind at 76%. In general, African and Asian nations tended to have higher levels of trust in the UN, though there were exceptions like South Africa (53%) and South Korea (56%)
It’s also worth noting that views within countries can differ significantly. Separate data on this topic from Pew Research shows that public opinion of the UN is split along ideological lines. In the U.S., there’s a 45 percentage point difference, with more conservative respondents having significantly lower trust in the UN.

-

 Markets1 week ago
U.S. Debt Interest Payments Reach $1 Trillion
-

 Markets2 weeks ago
Ranked: The Most Valuable Housing Markets in America
-

 Money2 weeks ago
Which States Have the Highest Minimum Wage in America?
-

 AI2 weeks ago
Ranked: Semiconductor Companies by Industry Revenue Share
-

 Markets2 weeks ago
Ranked: The World’s Top Flight Routes, by Revenue
-

 Countries2 weeks ago
Population Projections: The World’s 6 Largest Countries in 2075
-

 Markets2 weeks ago
The Top 10 States by Real GDP Growth in 2023
-

 Money2 weeks ago
The Smallest Gender Wage Gaps in OECD Countries