Markets
Mapped: The State of Small Business Recovery in America


Mapped: The State of Small Business Recovery in America
In the business news cycle, headlines are often dominated by large corporations, macroeconomic news, or government action.
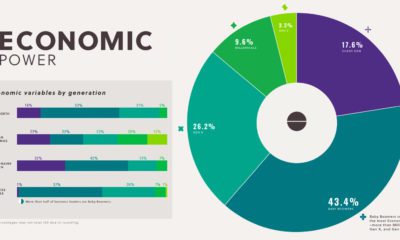
While mom and pop might not always be in focus, collectively small businesses are a powerful and influential piece of the economy. In fact, 99.9% of all businesses in the U.S. qualify as small businesses, collectively employing almost half (47.3%) of the nation’s private workforce.
Unfortunately, they’ve also been one of the hardest-hit sectors of the economy amid the pandemic. From the CARES Act to the new budget proposal, billions of dollars have been allocated towards helping small businesses to get back on their feet.
Small Business Recovery in 50 Metro Areas
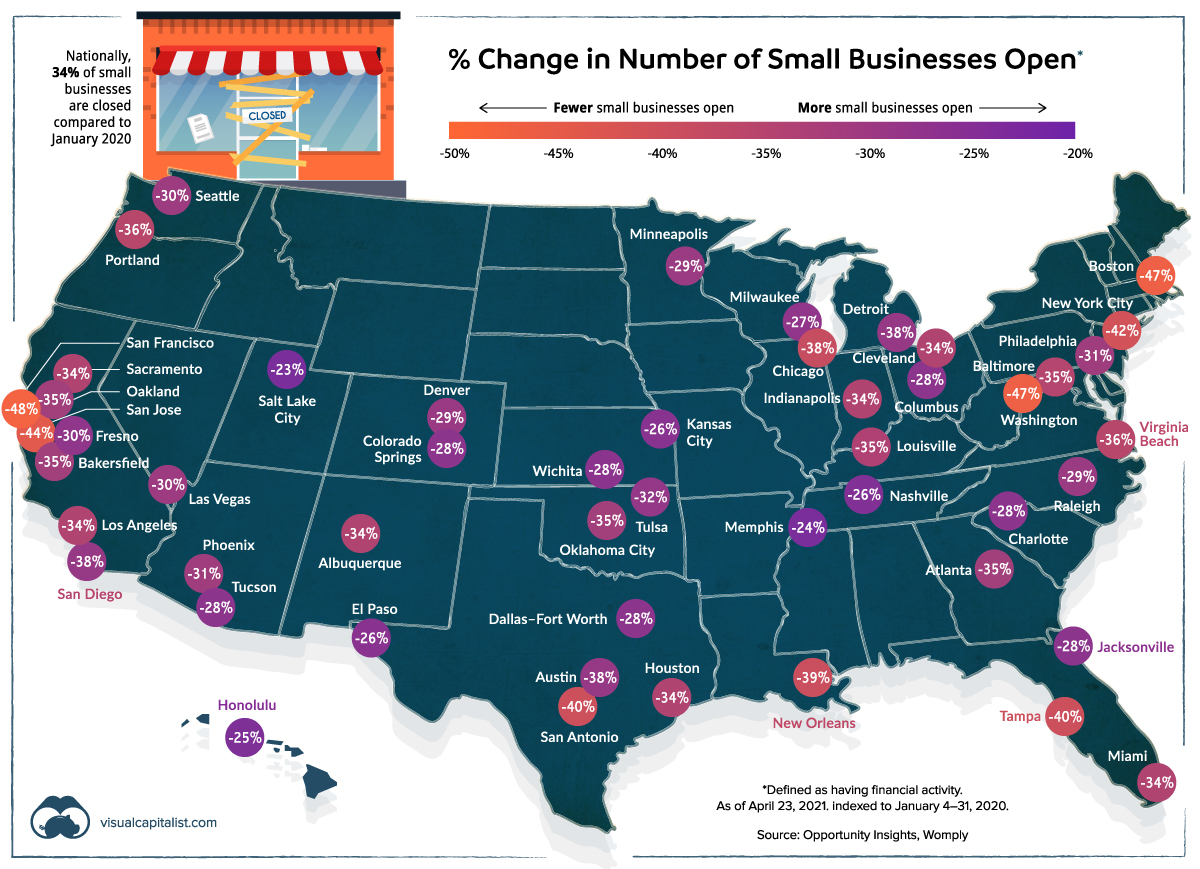
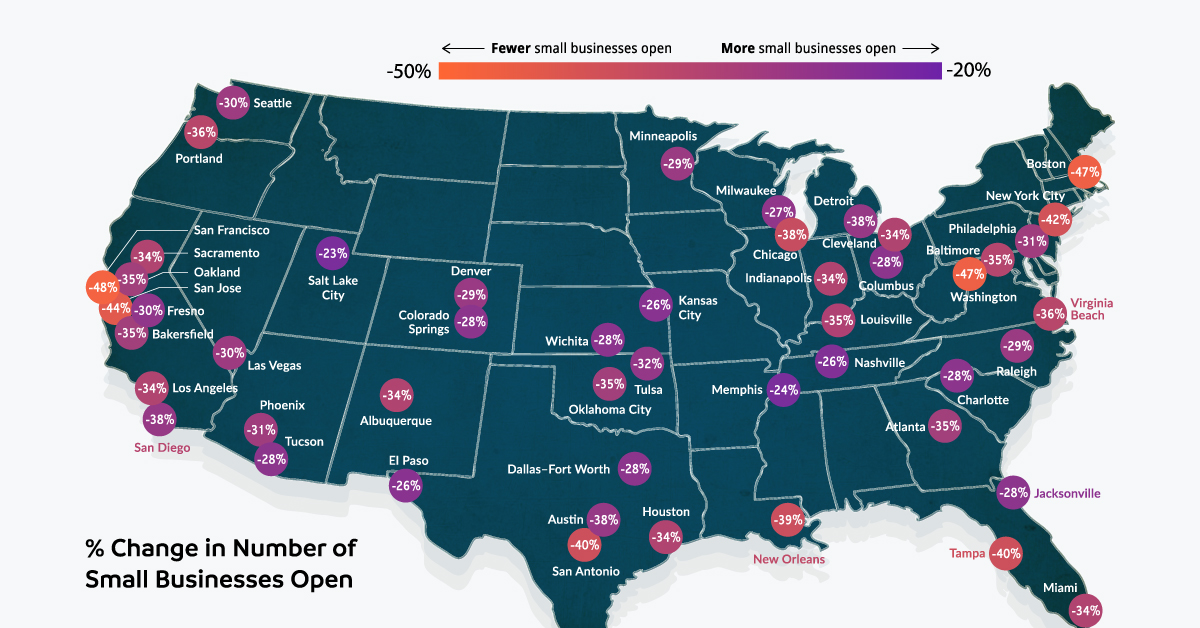
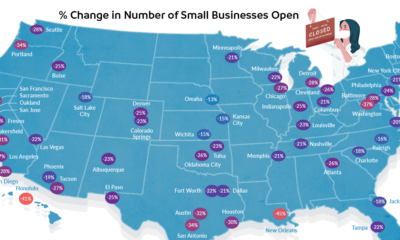
During the pandemic, many small businesses have either swiftly pivoted to survive, or struggled to stay afloat. This map pulls data from Opportunity Insights to examine the small business recovery rate in 50 metro areas across America.
So, has the situation improved since the last time we examined this data? The short answer is no—on a national scale, 34% of small businesses are closed compared to January 2020.
San Francisco is one of the most affected metro areas, with a 48% closure rate of small businesses. New York City has spiralled the most since the end of September 2020.
| U.S. Metro Area | % Change in # of Small Businesses Open (As of Sep 25, 2020) | % Change in # of Small Businesses Open (As of Apr 23, 2021) | 7-month change (p.p.) |
|---|---|---|---|
| Albuquerque | -23% | -34% | -11 |
| Atlanta | -26% | -35% | -9 |
| Austin | -32% | -38% | -6 |
| Bakersfield | -31% | -35% | -4 |
| Baltimore | -28% | -35% | -7 |
| Boston | -33% | -47% | -14 |
| Charlotte | -18% | -28% | -10 |
| Chicago | -27% | -38% | -11 |
| Cleveland | -26% | -34% | -8 |
| Colorado Springs | -23% | -28% | -5 |
| Columbus | -21% | -28% | -7 |
| Dallas-Fort Worth | -21% | -28% | -7 |
| Denver | -25% | -29% | -4 |
| Detroit | -28% | -38% | -10 |
| El Paso | -25% | -26% | -1 |
| Fresno | -26% | -30% | -4 |
| Honolulu | -41% | -25% | +16 |
| Houston | -30% | -34% | -4 |
| Indianapolis | -25% | -34% | -9 |
| Jacksonville | -18% | -28% | -10 |
| Kansas City | -15% | -26% | -11 |
| Las Vegas | -22% | -30% | -8 |
| Los Angeles | -27% | -34% | -7 |
| Louisville | -23% | -35% | -12 |
| Memphis | -21% | -24% | -3 |
| Miami | -23% | -34% | -11 |
| Milwaukee | -22% | -27% | -5 |
| Minneapolis | -21% | -29% | -8 |
| Nashville | -21% | -26% | -5 |
| New Orleans | -45% | -39% | +6 |
| New York City | -21% | -42% | -21 |
| Oakland | -32% | -35% | -3 |
| Oklahoma City | -26% | -35% | -9 |
| Philadelphia | -24% | -31% | -7 |
| Phoenix | -19% | -31% | -12 |
| Portland | -34% | -36% | -2 |
| Raleigh | -16% | -29% | -13 |
| Sacramento | -33% | -34% | -1 |
| Salt Lake City | -18% | -23% | -5 |
| San Antonio | -34% | -40% | -6 |
| San Diego | -28% | -38% | -10 |
| San Francisco | -49% | -48% | +2 |
| San Jose | -35% | -44% | -9 |
| Seattle | -28% | -30% | -2 |
| Tampa | -22% | -40% | -18 |
| Tucson | -27% | -28% | -1 |
| Tulsa | -23% | -32% | -9 |
| Virginia Beach | - | -36% | 0 |
| Washington DC | -37% | -47% | -10 |
| Wichita | -15% | -28% | -13 |
Data as of Apr 23, 2021 and indexed to Jan 4-31, 2020.
On the flip side, Honolulu has seen the most improvement. As travel and tourism numbers into Hawaii have steadily risen up with lifted nationwide restrictions, there has been a 16 p.p. increase in open businesses compared to September 2020.
Road to a K-Shaped Recovery
As of April 25, 2021, nearly 42% of the U.S. population has received at least one dose of a COVID-19 vaccine. However, even with this rapid vaccine rollout, various segments of the economy aren’t recovering at the same pace.
Take for instance the stark difference between professional services and the leisure and hospitality sector. Though small business revenues in both segments have yet to return to pre-pandemic levels, the latter has much more catching up to do:
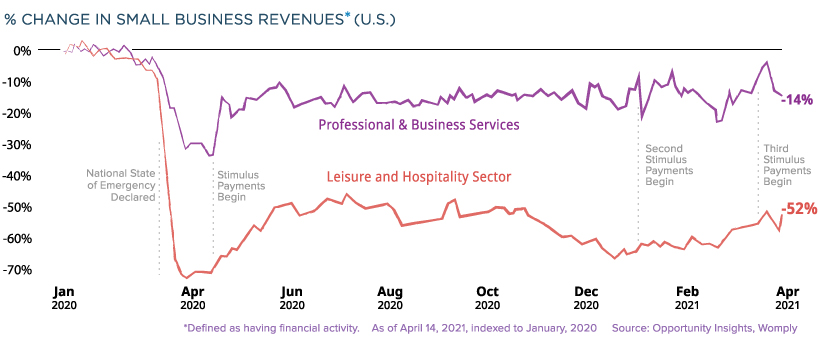
This uneven phenomena is known as a K-shaped recovery, where some industries see more improvement compared to others that stagnate in the aftermath of a recession.
The Entrepreneurial Spirit Endures
Despite these continued hardships, it appears that many Americans have not been deterred from starting their own businesses.
Many small businesses require an Employer Identification Number (EIN) which makes EIN applications a good proxy for business formation activity. Despite an initial dip in the early months of the pandemic, there has been a dramatic spike in EIN business applications.
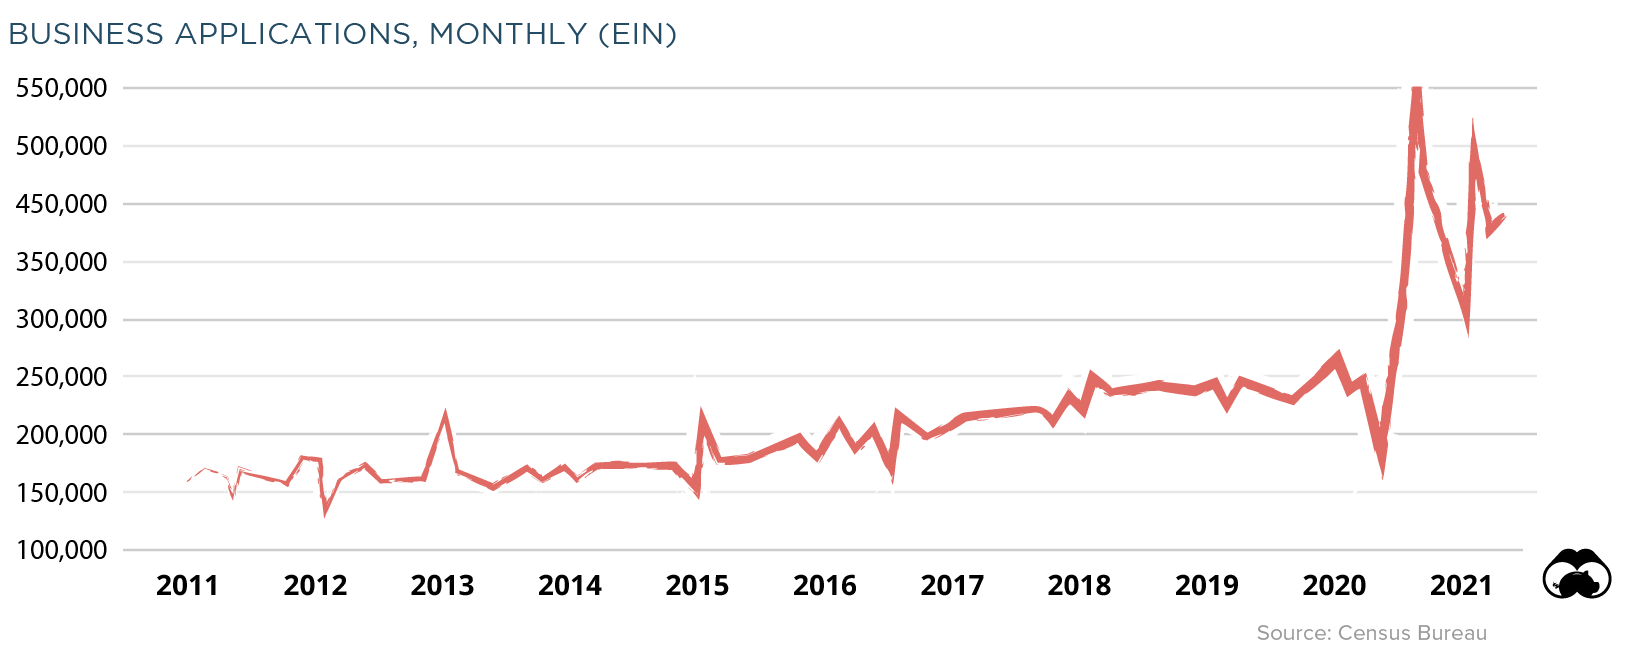
Even in the face of a global pandemic, the perseverance of such metrics prove that the innovative American spirit is unwavering, and spells better days to come for small business recovery.


Markets
Visualizing Global Inflation Forecasts (2024-2026)
Here are IMF forecasts for global inflation rates up to 2026, highlighting a slow descent of price pressures amid resilient global growth.


Visualizing Global Inflation Forecasts (2024-2026)
Global inflation rates are gradually descending, but progress has been slow.
Today, the big question is if inflation will decline far enough to trigger easing monetary policy. So far, the Federal Reserve has held rates for nine months amid stronger than expected core inflation, which excludes volatile energy and food prices.
Yet looking further ahead, inflation forecasts from the International Monetary Fund (IMF) suggest that inflation will decline as price pressures ease, but the path of disinflation is not without its unknown risks.
This graphic shows global inflation forecasts, based on data from the April 2024 IMF World Economic Outlook.
Get the Key Insights of the IMF’s World Economic Outlook
Want a visual breakdown of the insights from the IMF’s 2024 World Economic Outlook report?
This visual is part of a special dispatch of the key takeaways exclusively for VC+ members.
Get the full dispatch of charts by signing up to VC+.
The IMF’s Inflation Outlook
Below, we show the IMF’s latest projections for global inflation rates through to 2026:
| Year | Global Inflation Rate (%) | Advanced Economies Inflation Rate (%) | Emerging Market and Developing Economies Inflation Rate (%) |
|---|---|---|---|
| 2019 | 3.5 | 1.4 | 5.1 |
| 2020 | 3.2 | 0.7 | 5.2 |
| 2021 | 4.7 | 3.1 | 5.9 |
| 2022 | 8.7 | 7.3 | 9.8 |
| 2023 | 6.8 | 4.6 | 8.3 |
| 2024 | 5.9 | 2.6 | 8.3 |
| 2025 | 4.5 | 2.0 | 6.2 |
| 2026 | 3.7 | 2.0 | 4.9 |
After hitting a peak of 8.7% in 2022, global inflation is projected to fall to 5.9% in 2024, reflecting promising inflation trends amid resilient global growth.
While inflation has largely declined due to falling energy and goods prices, persistently high services inflation poses challenges to mitigating price pressures. In addition, the IMF highlights the potential risk of an escalating conflict in the Middle East, which could lead to energy price shocks and higher shipping costs.
These developments could negatively affect inflation scenarios and prompt central banks to adopt tighter monetary policies. Overall, by 2026, global inflation is anticipated to decline to 3.7%—still notably above the 2% target set by several major economies.
Adding to this, we can see divergences in the path of inflation between advanced and emerging economies. While affluent nations are forecast to see inflation edge closer to the 2% target by 2026, emerging economies are projected to have inflation rates reach 4.9%—falling closer to their pre-pandemic averages.
Get the Full Analysis of the IMF’s Outlook on VC+
This visual is part of an exclusive special dispatch for VC+ members which breaks down the key takeaways from the IMF’s 2024 World Economic Outlook.
For the full set of charts and analysis, sign up for VC+.

-

 Business6 days ago
The Top Private Equity Firms by Country
-

 Countries2 weeks ago
Countries With the Largest Happiness Gains Since 2010
-

 VC+2 weeks ago
VC+: Get Our Key Takeaways From the IMF’s World Economic Outlook
-

 Demographics2 weeks ago
The Countries That Have Become Sadder Since 2010
-

 Money2 weeks ago
Charted: Who Has Savings in This Economy?
-

 Technology2 weeks ago
Visualizing AI Patents by Country
-

 Economy2 weeks ago
Economic Growth Forecasts for G7 and BRICS Countries in 2024
-

 Wealth1 week ago
Charted: Which City Has the Most Billionaires in 2024?