Markets
The Largest Export of Every U.S. State in 2017
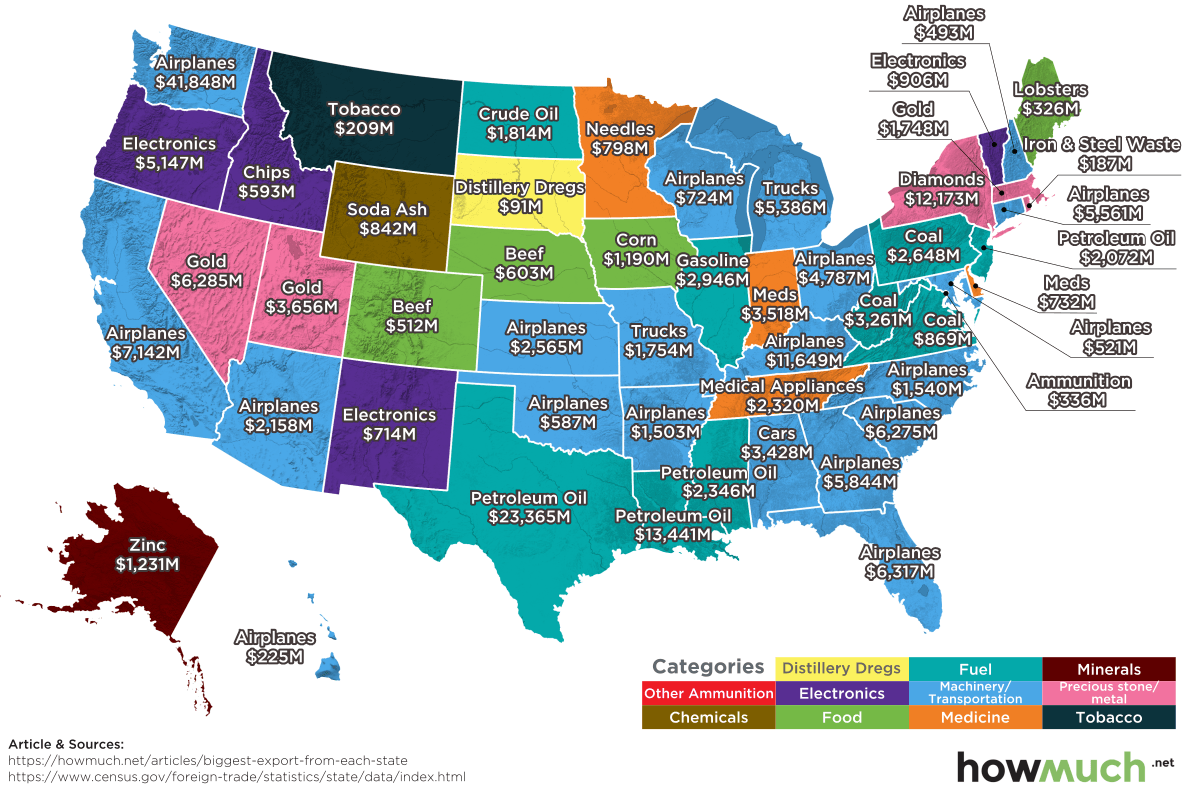
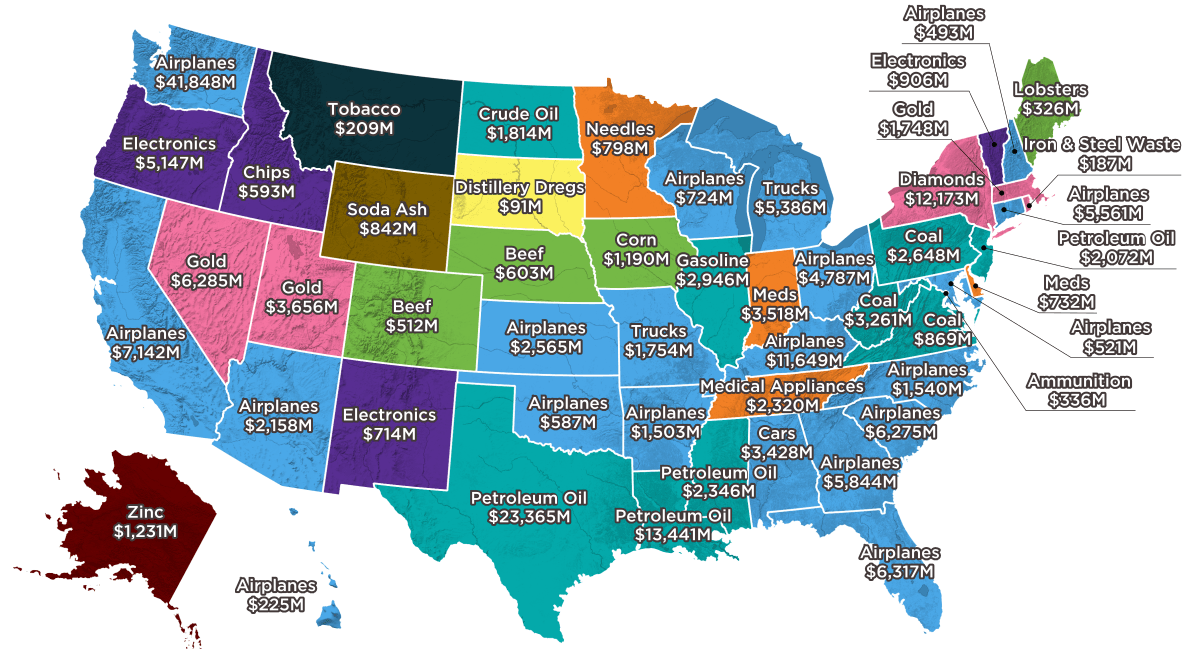
The Largest Export of Every U.S. State in 2017
Last year, the U.S. exported $2.3 trillion worth of goods to international customers.
The country’s main exports are exactly what one would expect, with categories like aircraft, refined petroleum, vehicles, vehicle parts, and computer chips constituting the biggest chunk of overall goods.
However, today’s infographic from HowMuch.net zooms down to the state level, where things get much more interesting. Some states tow the line by exporting one of the major U.S. goods, while others specialize in categories that you probably couldn’t ever guess.
Towing the Line
We’ll start by looking at dollar values for the states that have the single largest exports.
Here are the top 10 states:
| Rank | State | Type of Good | 2017 Value |
|---|---|---|---|
| #1 | Washington | Airplanes | $41.8 billion |
| #2 | Texas | Petroleum | $23.4 billion |
| #3 | Louisiana | Petroleum | $13.4 billion |
| #4 | New York | Diamonds | $12.2 billion |
| #5 | Kentucky | Airplanes | $11.6 billion |
| #6 | California | Airplanes | $7.1 billion |
| #7 | Florida | Airplanes | $6.3 billion |
| #8 | Nevada | Gold | $6.3 billion |
| #9 | South Carolina | Airplanes | $6.3 billion |
| #10 | Georgia | Airplanes | $5.8 billion |
Not surprisingly, some of the top national exports are represented here.
Airplanes dominate the list, and Boeing’s presence in particular is clearly felt. The company’s major factory in Everett, WA – the largest building in the world by volume – helps the state of Washington generate $41.8 billion in export sales from the aerospace sector. That said, airplanes are also the top export good for five other states in the above list.
The Gulf Coast is also well-represented with Texas and Louisiana as major refined oil exporters. New York (Diamonds) and Nevada (Gold) round out the list.
Keeping Exports Weird
The smaller the state, the better chance it has of specializing in a type of good that is outside of the norm.
Possibly the title of “Most Unusual Top State Export” can go to South Dakota, which sent $91 million of distillery dregs outside of the country in 2017. In case you were wondering, the U.S. Census Bureau’s full category title for this is as follows: BREWING OR DISTILLING DREGS AND WASTE, W/NT PELLET.
This spent grain is a byproduct of brewing or distilling processes, and is primarily sold for use in making animal feeds.
Other strange top exports?
The biggest state export of Wyoming is soda ash, which is used to manufacture of glass, paper, rayon, soaps, and detergents. In 2017, the state exported $842 million of soda ash, which is 10x larger than its second-biggest export category, which is also an uncommon one: rare gases.
Other interesting states include Rhode Island, which exported $187 million of iron and steel waste, as well as Maine – a state that shipped away $326 million of its famous lobsters.


Markets
The European Stock Market: Attractive Valuations Offer Opportunities
On average, the European stock market has valuations that are nearly 50% lower than U.S. valuations. But how can you access the market?


European Stock Market: Attractive Valuations Offer Opportunities
Europe is known for some established brands, from L’Oréal to Louis Vuitton. However, the European stock market offers additional opportunities that may be lesser known.
The above infographic, sponsored by STOXX, outlines why investors may want to consider European stocks.
Attractive Valuations
Compared to most North American and Asian markets, European stocks offer lower or comparable valuations.
| Index | Price-to-Earnings Ratio | Price-to-Book Ratio |
|---|---|---|
| EURO STOXX 50 | 14.9 | 2.2 |
| STOXX Europe 600 | 14.4 | 2 |
| U.S. | 25.9 | 4.7 |
| Canada | 16.1 | 1.8 |
| Japan | 15.4 | 1.6 |
| Asia Pacific ex. China | 17.1 | 1.8 |
Data as of February 29, 2024. See graphic for full index names. Ratios based on trailing 12 month financials. The price to earnings ratio excludes companies with negative earnings.
On average, European valuations are nearly 50% lower than U.S. valuations, potentially offering an affordable entry point for investors.
Research also shows that lower price ratios have historically led to higher long-term returns.
Market Movements Not Closely Connected
Over the last decade, the European stock market had low-to-moderate correlation with North American and Asian equities.
The below chart shows correlations from February 2014 to February 2024. A value closer to zero indicates low correlation, while a value of one would indicate that two regions are moving in perfect unison.
| EURO STOXX 50 | STOXX EUROPE 600 | U.S. | Canada | Japan | Asia Pacific ex. China |
|
|---|---|---|---|---|---|---|
| EURO STOXX 50 | 1.00 | 0.97 | 0.55 | 0.67 | 0.24 | 0.43 |
| STOXX EUROPE 600 | 1.00 | 0.56 | 0.71 | 0.28 | 0.48 | |
| U.S. | 1.00 | 0.73 | 0.12 | 0.25 | ||
| Canada | 1.00 | 0.22 | 0.40 | |||
| Japan | 1.00 | 0.88 | ||||
| Asia Pacific ex. China | 1.00 |
Data is based on daily USD returns.
European equities had relatively independent market movements from North American and Asian markets. One contributing factor could be the differing sector weights in each market. For instance, technology makes up a quarter of the U.S. market, but health care and industrials dominate the broader European market.
Ultimately, European equities can enhance portfolio diversification and have the potential to mitigate risk for investors.
Tracking the Market
For investors interested in European equities, STOXX offers a variety of flagship indices:
| Index | Description | Market Cap |
|---|---|---|
| STOXX Europe 600 | Pan-regional, broad market | €10.5T |
| STOXX Developed Europe | Pan-regional, broad-market | €9.9T |
| STOXX Europe 600 ESG-X | Pan-regional, broad market, sustainability focus | €9.7T |
| STOXX Europe 50 | Pan-regional, blue-chip | €5.1T |
| EURO STOXX 50 | Eurozone, blue-chip | €3.5T |
Data is as of February 29, 2024. Market cap is free float, which represents the shares that are readily available for public trading on stock exchanges.
The EURO STOXX 50 tracks the Eurozone’s biggest and most traded companies. It also underlies one of the world’s largest ranges of ETFs and mutual funds. As of November 2023, there were €27.3 billion in ETFs and €23.5B in mutual fund assets under management tracking the index.
“For the past 25 years, the EURO STOXX 50 has served as an accurate, reliable and tradable representation of the Eurozone equity market.”
— Axel Lomholt, General Manager at STOXX
Partnering with STOXX to Track the European Stock Market
Are you interested in European equities? STOXX can be a valuable partner:
- Comprehensive, liquid and investable ecosystem
- European heritage, global reach
- Highly sophisticated customization capabilities
- Open architecture approach to using data
- Close partnerships with clients
- Part of ISS STOXX and Deutsche Börse Group
With a full suite of indices, STOXX can help you benchmark against the European stock market.
Learn how STOXX’s European indices offer liquid and effective market access.

-

 Economy4 days ago
Economic Growth Forecasts for G7 and BRICS Countries in 2024
The IMF has released its economic growth forecasts for 2024. How do the G7 and BRICS countries compare?
-

 Markets2 weeks ago
U.S. Debt Interest Payments Reach $1 Trillion
U.S. debt interest payments have surged past the $1 trillion dollar mark, amid high interest rates and an ever-expanding debt burden.
-

 United States2 weeks ago
Ranked: The Largest U.S. Corporations by Number of Employees
We visualized the top U.S. companies by employees, revealing the massive scale of retailers like Walmart, Target, and Home Depot.
-

 Markets2 weeks ago
The Top 10 States by Real GDP Growth in 2023
This graphic shows the states with the highest real GDP growth rate in 2023, largely propelled by the oil and gas boom.
-

 Markets3 weeks ago
Ranked: The World’s Top Flight Routes, by Revenue
In this graphic, we show the highest earning flight routes globally as air travel continued to rebound in 2023.
-

 Markets3 weeks ago
Ranked: The Most Valuable Housing Markets in America
The U.S. residential real estate market is worth a staggering $47.5 trillion. Here are the most valuable housing markets in the country.


-

 Science1 week ago
Visualizing the Average Lifespans of Mammals
-

 Demographics2 weeks ago
The Smallest Gender Wage Gaps in OECD Countries
-

 United States2 weeks ago
Where U.S. Inflation Hit the Hardest in March 2024
-

 Green2 weeks ago
Top Countries By Forest Growth Since 2001
-
United States2 weeks ago
Ranked: The Largest U.S. Corporations by Number of Employees
-

 Maps2 weeks ago
The Largest Earthquakes in the New York Area (1970-2024)
-

 Green2 weeks ago
Ranked: The Countries With the Most Air Pollution in 2023
-

 Green2 weeks ago
Ranking the Top 15 Countries by Carbon Tax Revenue