This interactive graphic shows the poverty rate of every state, and also how poverty levels have changed over time according to the U.S. Census Bureau.
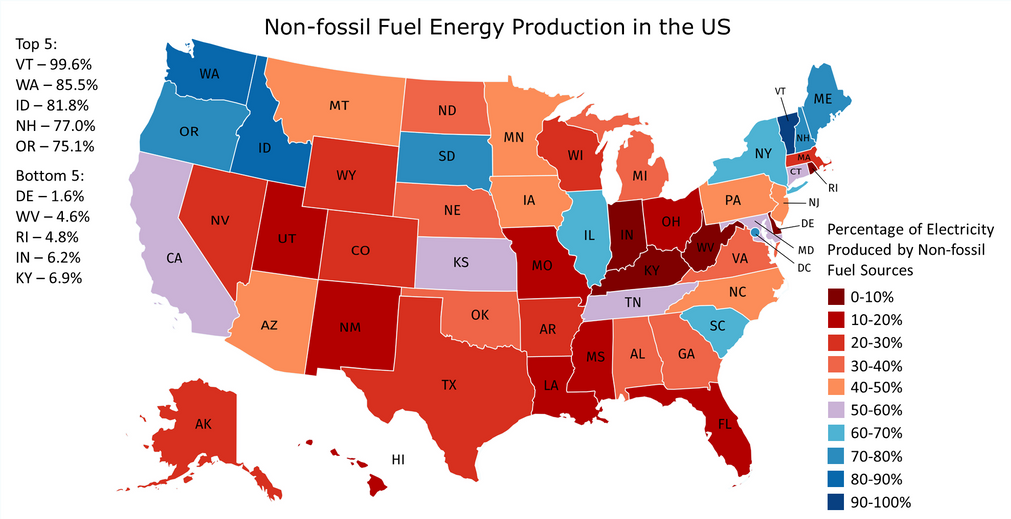
In countries where energy is plentiful, we often take the grid for granted. But do you know where your power comes from, and how green it...
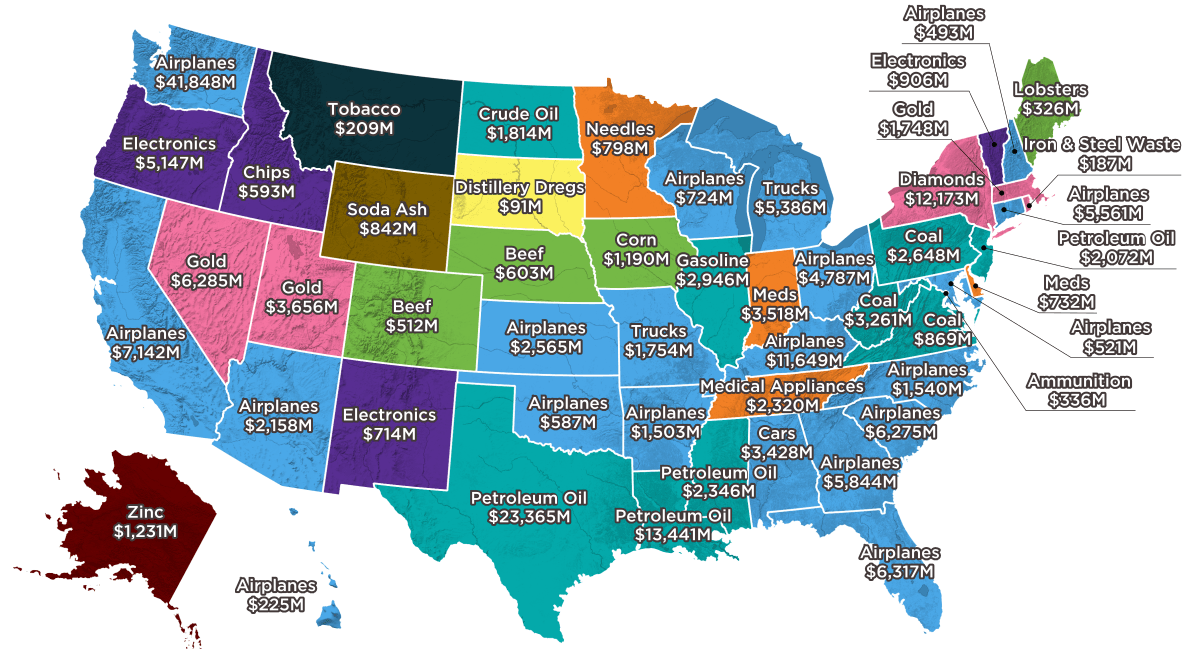
Largest state exports range from common goods, like autos, planes, and oil, to far more peculiar goods like distillery dregs, lobsters, and soda ash.
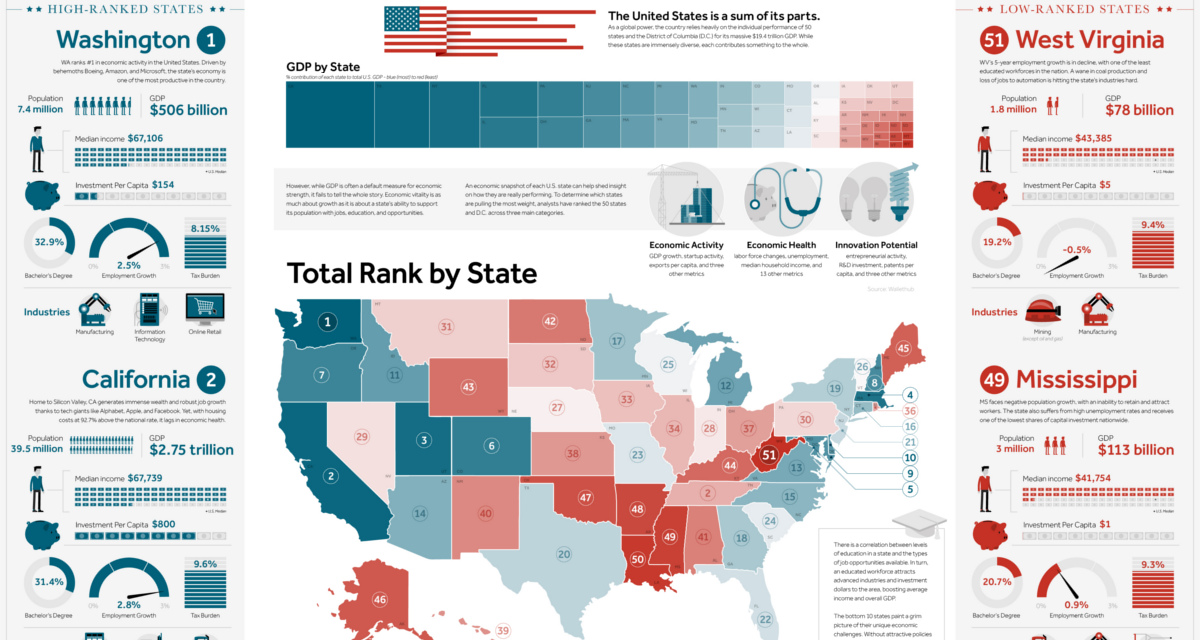
This giant infographic has state economies ranked from best to worst, based on an overall score comprised of 27 different metrics.
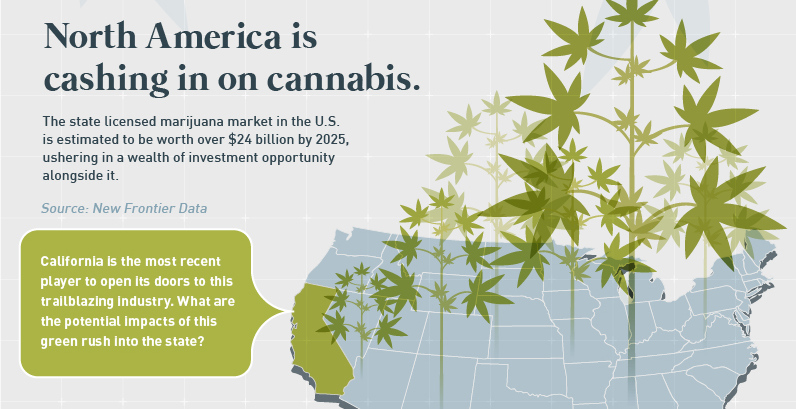
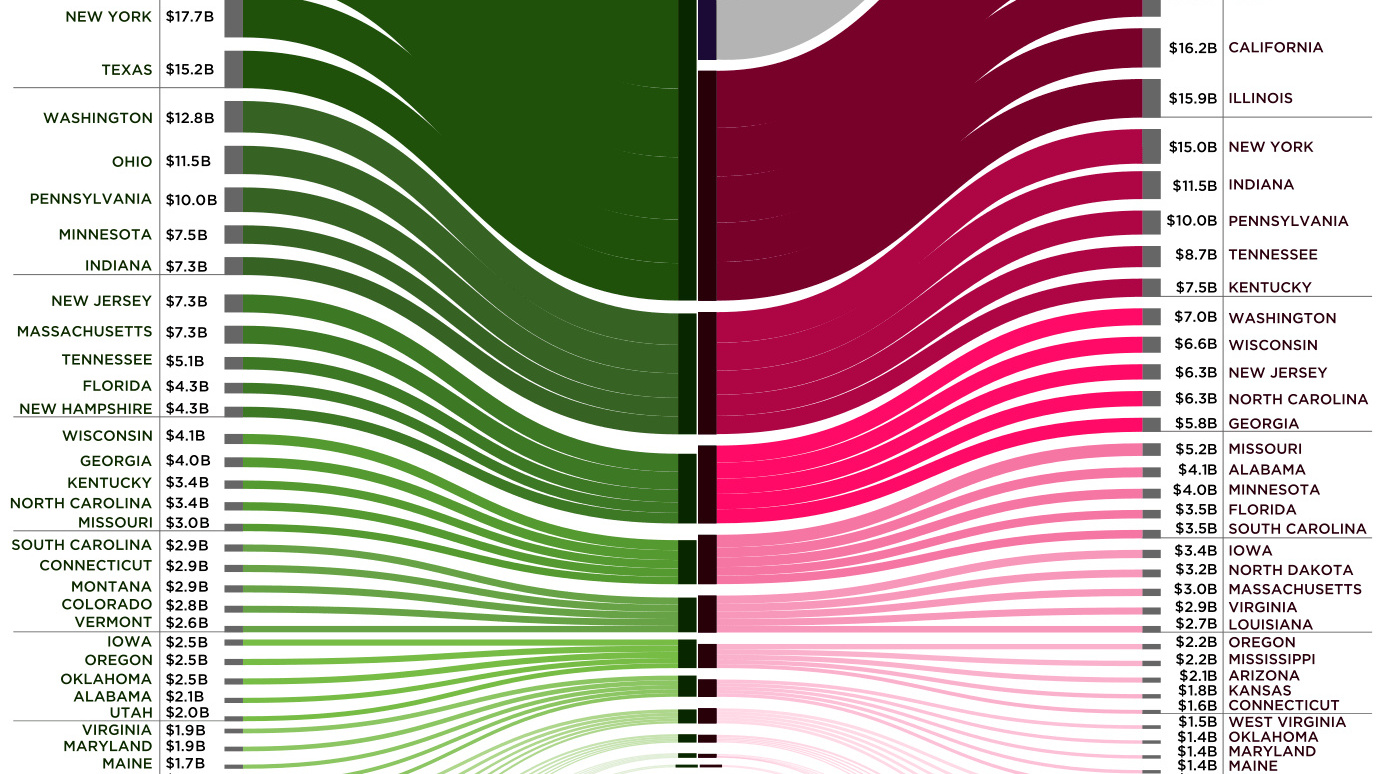
California is now the largest legal market for cannabis in the world. Here's how legalization will impact the state's economy.
Canada is the largest international trade partner for most U.S. states - use this visualization to see how connected every state is to neighbors to the...
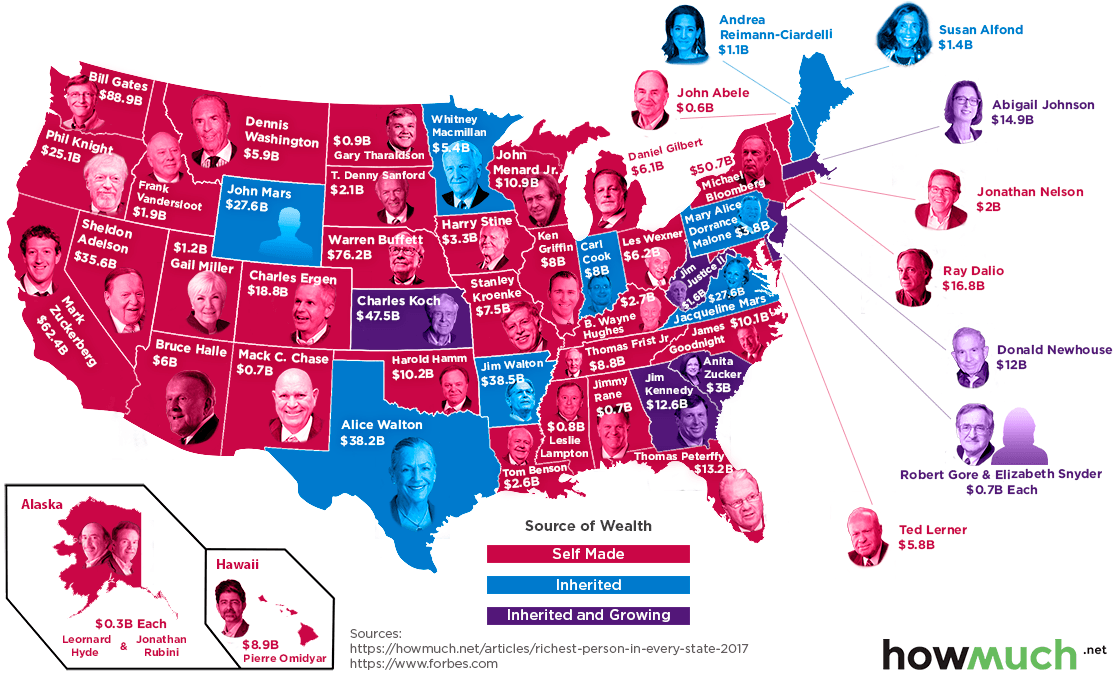
With fortunes ranging from $88.9B (Bill Gates) to $340M (Leonard Hyde), here is the richest person in each state in 2017, according to Forbes.
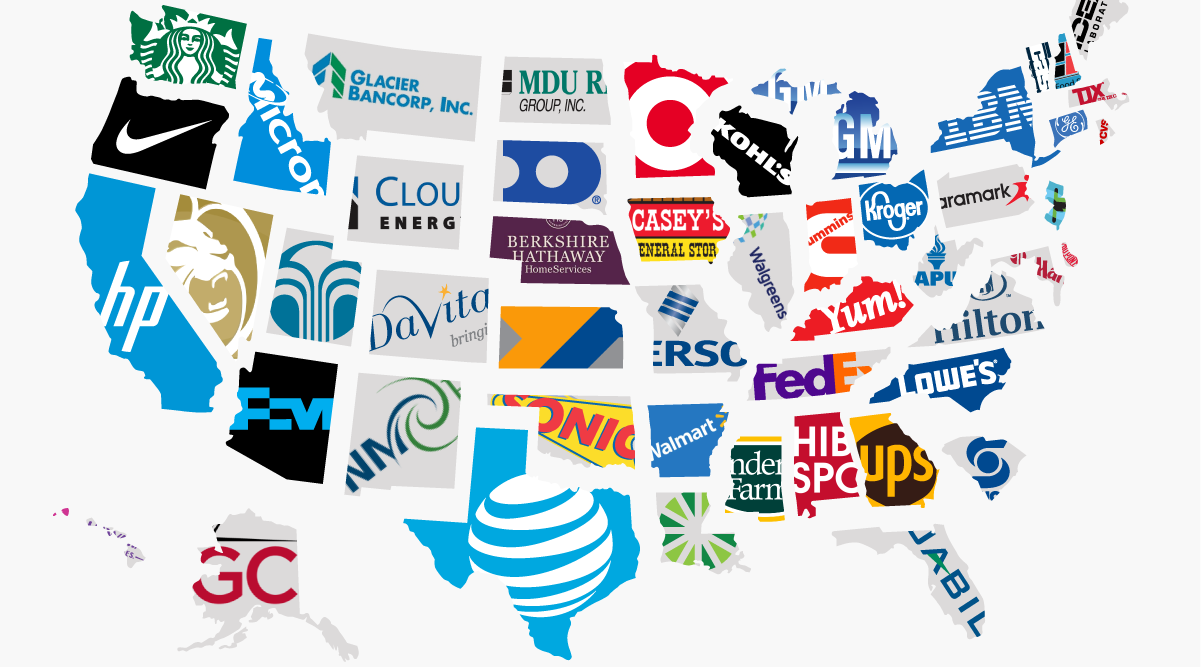
What is the largest company in each state? This infographic breaks it down based on the number of employees.
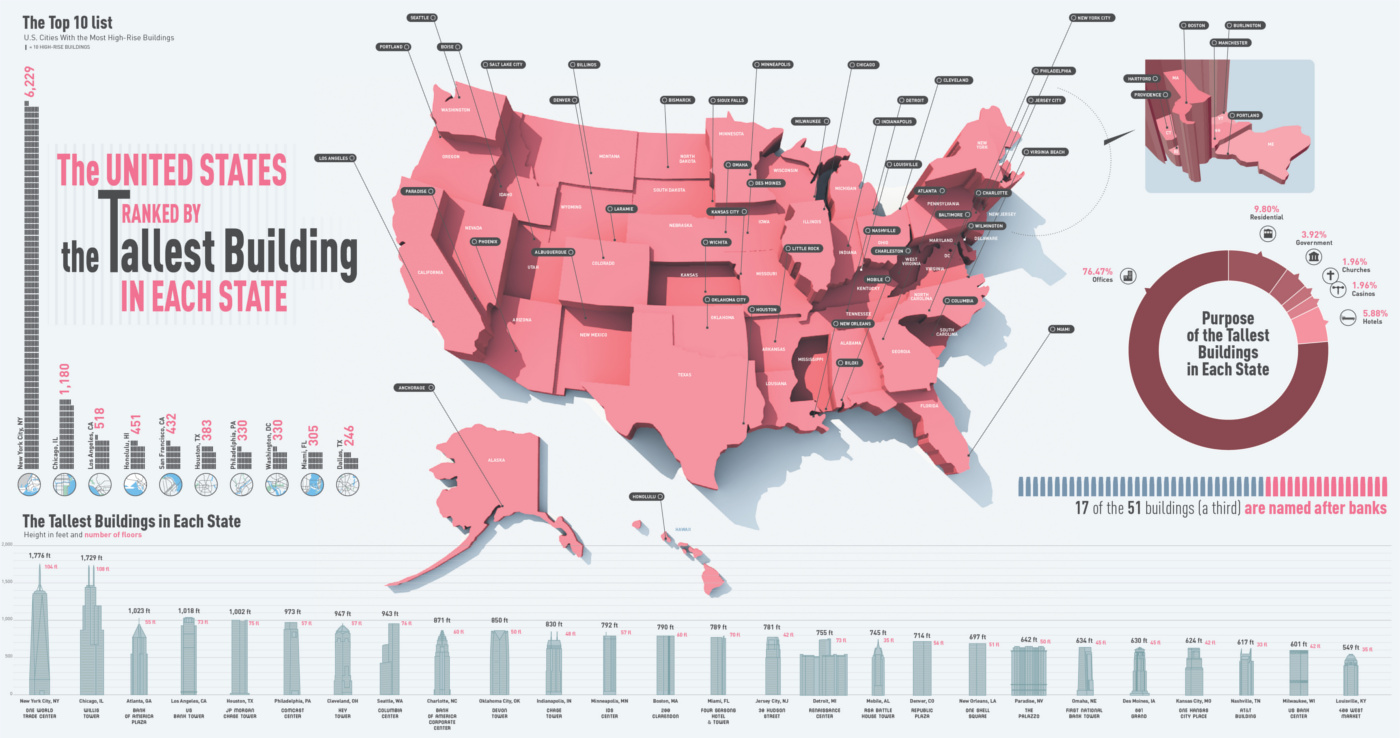
This infographic shows the tallest building in each state, ranging from the 1,776 ft tall One World Trade Center in NYC to the 124 ft Decker...
The cost of living by state and county varies significantly. Here's how far $100 will go in every part of America.


