Money
The Richest Person in Every U.S. State in 2017
Check out the latest 2023 update of the richest person in every U.S. state.
The Richest Person in Every U.S. State in 2017
Check out the latest 2023 update of the richest person in every U.S. state.
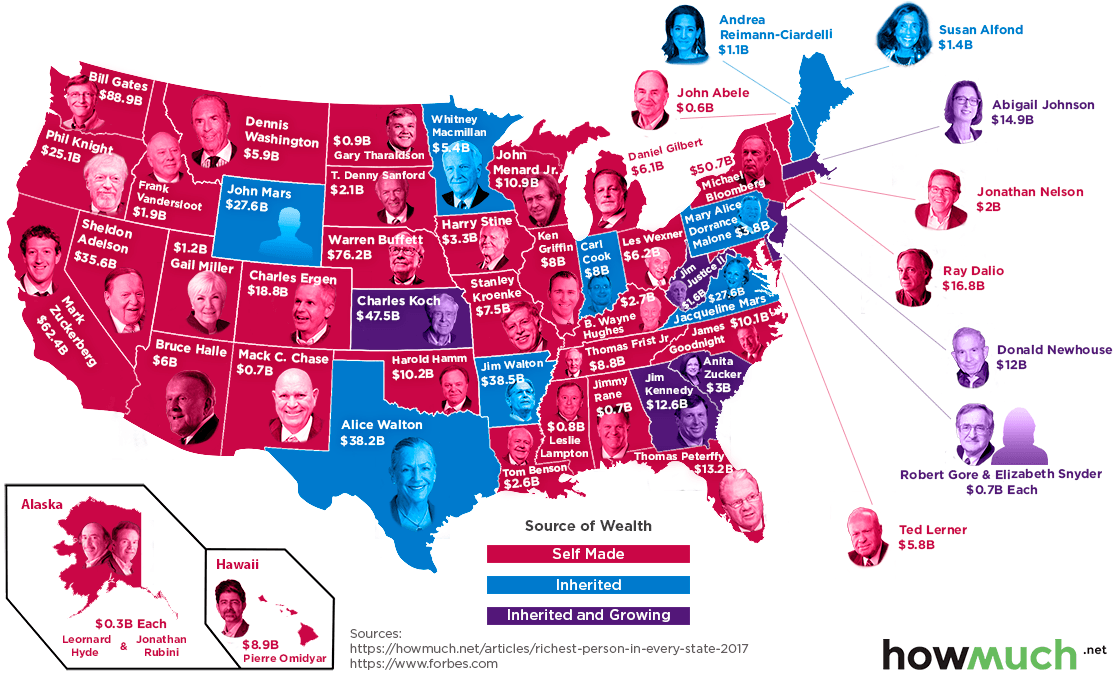
The massive empires of business tycoons like Bill Gates, Warren Buffett, and Jeff Bezos are continually topics of discussion throughout the world, but much less attention finds its way towards the largest personal fortunes at the state level.
That’s because while some of the wealthiest people in their respective states are household names, such as Ray Dalio (Connecticut) or Michael Bloomberg (New York), the majority of people on this list fly below the radar at both the national and international levels. Further, the dropoff from the largest to smallest fortunes on the list is also steeper than you might think.
Examining the Top 10 States
Today’s visualization, which shows the richest person in every U.S. state in 2017, comes from cost information site HowMuch.net while using the latest information from Forbes.
Here’s how the list of the top 10 states round out:
| Rank | Person | State | Fortune | Source |
|---|---|---|---|---|
| #1 | Bill Gates | Washington | $88.9B | Self-made |
| #2 | Warren Buffett | Nebraska | $76.2B | Self-made |
| #3 | Mark Zuckerberg | California | $62.4B | Self-made |
| #4 | Michael Bloomberg | New York | $50.7B | Self-made |
| #5 | Charles Koch | Kansas | $47.5B | Inherited & Growing |
| #6 | Jim Walton | Arkansas | $38.5B | Inherited |
| #7 | Alice Walton | Texas | $38.2B | Inherited |
| #8 | Sheldon Adelson | Nevada | $35.6B | Self-made |
| #9 | John Mars | Wyoming | $27.6B | Inherited |
| #10 | Jacqueline Mars | Virginia | $27.6B | Inherited |
While their fortunes don’t quite compare to the richest people in human history, the numbers above are still very impressive.
The list is topped by Bill Gates, who was briefly overtaken as richest person in the world by fellow Seattleite Jeff Bezos for a short period of time in July, but now again sits in the #1 position. Not surprisingly, Mark Zuckerberg (California) and Michael Bloomberg (New York) also sit high, outranking other high net worth individuals from those states like Larry Ellison ($62.2 billion) or George Soros ($25.2 billion).
The list is dominated by those who are self-made or growing their fortunes, but the second half has billionaire siblings that inherited their family fortunes such as Jim and Alice Walton (Walmart), or John and Jacqueline Mars (Mars).
Flying Under the Radar
In some ways, the bottom portion of the rankings for the Richest Person in Every U.S. State is just as interesting. Many of these people are lesser known, and the disparity between these fortunes and those on the Top 10 list show how hard it really is to grow a fortune to the >$20 billion range.
| Rank | Person | State | Fortune | Source |
|---|---|---|---|---|
| #41 | Andrea Reimann-Ciardelli | New Hampshire | $1.1B | Inherited |
| #42 | Gary Tharaldson | North Dakota | $900M | Self-made |
| #43 | Leslie Lampton | Mississippi | $760M | Self-made |
| #44 (t) | Robert Gore | Delaware | $720M | Inherited & Growing |
| #44 (t) | Elizabeth Snyder | Delaware | $720M | Inherited & Growing |
| #46 (t) | Mack C. Chase | New Mexico | $700M | Self-made |
| #46 (t) | Jimmy Rane | Alabama | $700M | Self-made |
| #48 | John Abele | Vermont | $625M | Self-made |
| #49 (t) | Leonard Hyde | Alaska | $340M | Self-made |
| #49 (t) | Jonathan Rubini | Alaska | $340M | Self-made |
Just one person in the Bottom 10 is a billionaire – the rest have fortunes in the hundreds of millions.
The sources of the fortunes near the end of the list are also quite diverse. Robert Gore and Elizabeth Snyder (and their four other siblings) were the heirs to the Gore-Tex empire, each owning 7% of the company. Meanwhile, Mack C. Chase is an oil tycoon, John Abele has made his money from making medical devices, and Leonard Hyde and Jonathan Rubini are partners in a real estate firm that owns much of the Anchorage skyline.


Money
Charted: Which City Has the Most Billionaires in 2024?
Just two countries account for half of the top 20 cities with the most billionaires. And the majority of the other half are found in Asia.


Charted: Which Country Has the Most Billionaires in 2024?
This was originally posted on our Voronoi app. Download the app for free on iOS or Android and discover incredible data-driven charts from a variety of trusted sources.
Some cities seem to attract the rich. Take New York City for example, which has 340,000 high-net-worth residents with investable assets of more than $1 million.
But there’s a vast difference between being a millionaire and a billionaire. So where do the richest of them all live?
Using data from the Hurun Global Rich List 2024, we rank the top 20 cities with the highest number of billionaires in 2024.
A caveat to these rich lists: sources often vary on figures and exact rankings. For example, in last year’s reports, Forbes had New York as the city with the most billionaires, while the Hurun Global Rich List placed Beijing at the top spot.
Ranked: Top 20 Cities with the Most Billionaires in 2024
The Chinese economy’s doldrums over the course of the past year have affected its ultra-wealthy residents in key cities.
Beijing, the city with the most billionaires in 2023, has not only ceded its spot to New York, but has dropped to #4, overtaken by London and Mumbai.
| Rank | City | Billionaires | Rank Change YoY |
|---|---|---|---|
| 1 | 🇺🇸 New York | 119 | +1 |
| 2 | 🇬🇧 London | 97 | +3 |
| 3 | 🇮🇳 Mumbai | 92 | +4 |
| 4 | 🇨🇳 Beijing | 91 | -3 |
| 5 | 🇨🇳 Shanghai | 87 | -2 |
| 6 | 🇨🇳 Shenzhen | 84 | -2 |
| 7 | 🇭🇰 Hong Kong | 65 | -1 |
| 8 | 🇷🇺 Moscow | 59 | No Change |
| 9 | 🇮🇳 New Delhi | 57 | +6 |
| 10 | 🇺🇸 San Francisco | 52 | No Change |
| 11 | 🇹🇭 Bangkok | 49 | +2 |
| 12 | 🇹🇼 Taipei | 45 | +2 |
| 13 | 🇫🇷 Paris | 44 | -2 |
| 14 | 🇨🇳 Hangzhou | 43 | -5 |
| 15 | 🇸🇬 Singapore | 42 | New to Top 20 |
| 16 | 🇨🇳 Guangzhou | 39 | -4 |
| 17T | 🇮🇩 Jakarta | 37 | +1 |
| 17T | 🇧🇷 Sao Paulo | 37 | No Change |
| 19T | 🇺🇸 Los Angeles | 31 | No Change |
| 19T | 🇰🇷 Seoul | 31 | -3 |
In fact all Chinese cities on the top 20 list have lost billionaires between 2023–24. Consequently, they’ve all lost ranking spots as well, with Hangzhou seeing the biggest slide (-5) in the top 20.
Where China lost, all other Asian cities—except Seoul—in the top 20 have gained ranks. Indian cities lead the way, with New Delhi (+6) and Mumbai (+3) having climbed the most.
At a country level, China and the U.S combine to make up half of the cities in the top 20. They are also home to about half of the world’s 3,200 billionaire population.
In other news of note: Hurun officially counts Taylor Swift as a billionaire, estimating her net worth at $1.2 billion.

-

 Energy1 week ago
The World’s Biggest Nuclear Energy Producers
-

 Money2 weeks ago
Which States Have the Highest Minimum Wage in America?
-

 Technology2 weeks ago
Ranked: Semiconductor Companies by Industry Revenue Share
-

 Markets2 weeks ago
Ranked: The World’s Top Flight Routes, by Revenue
-

 Demographics2 weeks ago
Population Projections: The World’s 6 Largest Countries in 2075
-

 Markets2 weeks ago
The Top 10 States by Real GDP Growth in 2023
-

 Demographics2 weeks ago
The Smallest Gender Wage Gaps in OECD Countries
-

 Economy2 weeks ago
Where U.S. Inflation Hit the Hardest in March 2024