Misc
Visualizing the Tallest Building in Each State
The Tallest Building in Each State
For the full-size version of this giant infographic click here.
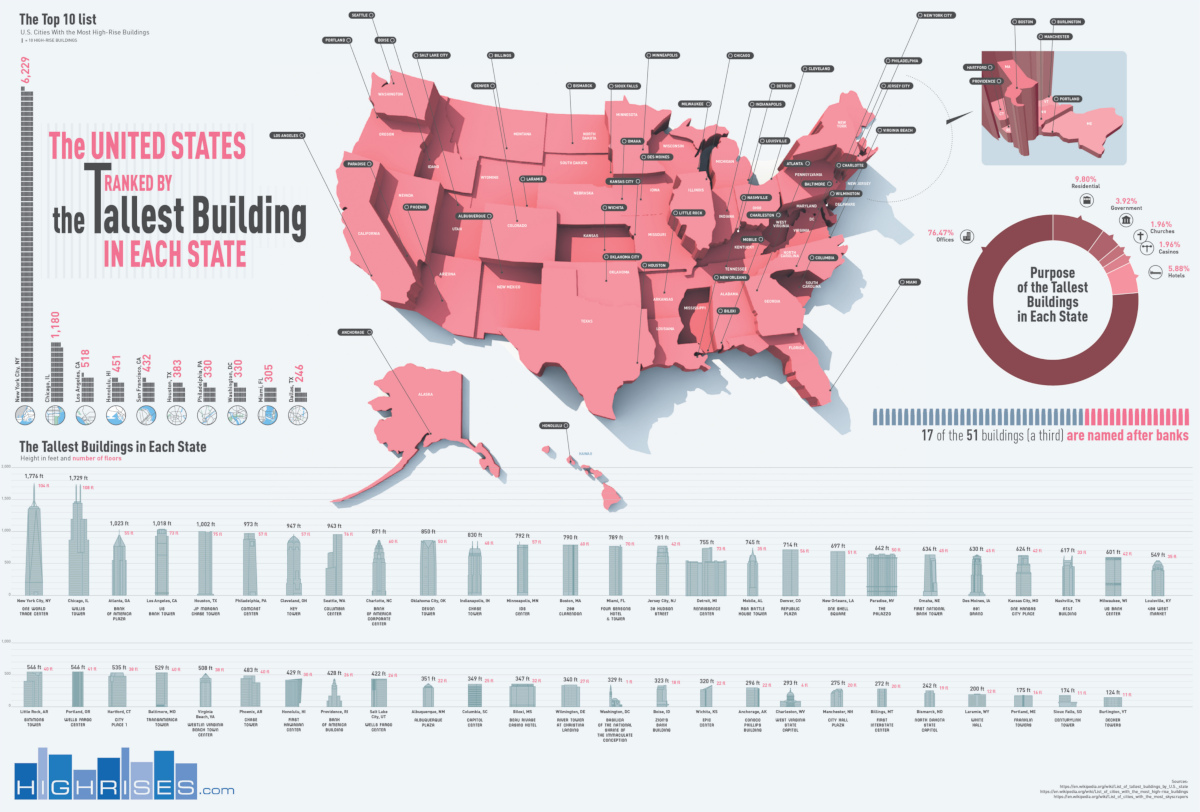
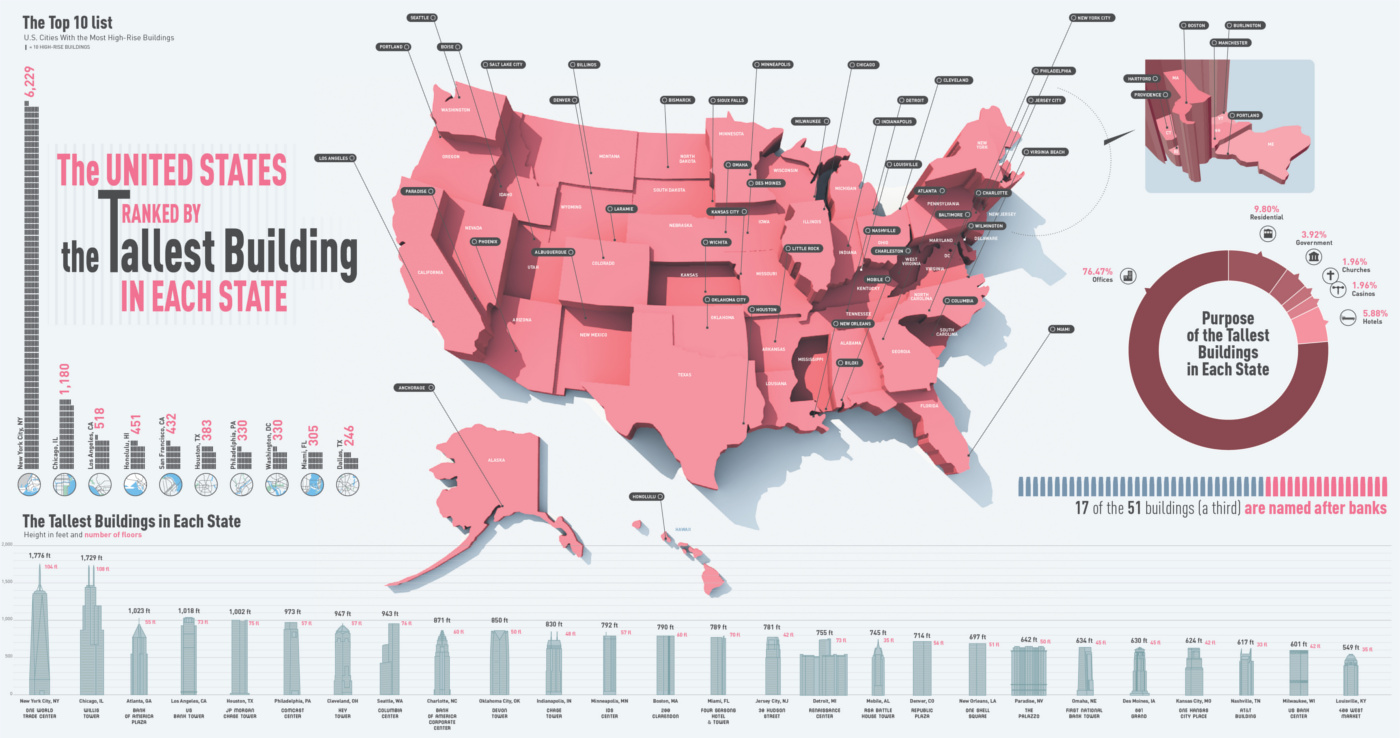
The United States has some of the world’s tallest skyscrapers, but their distribution is extremely uneven. Today’s infographic comes from Highrises.com, and it covers the tallest building in each state.
New York City alone has 6,229 highrises – more than the next nine cities combined, including Chicago, Los Angeles, Honolulu, San Francisco, Houston, Philadelphia, Washington D.C., Miami, and Dallas.
Surprisingly, multiple states don’t have a single building over 200 feet (61 m) tall. The tallest building in Vermont is an 11-story apartment building called Decker Towers. South Dakota is nearly as quaint – the CenturyLink Tower in Sioux Falls is the tallest building in the state, but it’s also only 11 stories tall.
Top Ten List: The Tallest States
Here is the building that tips the scale for each of the ten “tallest” states:
| Rank | Height (ft) | City | State | Building Name |
|---|---|---|---|---|
| 1 | 1,776 | New York City | NY | One World Trade Center |
| 2 | 1,729 | Chicago | IL | Willis Tower |
| 3 | 1,023 | Atlanta | GA | Bank of America Plaza |
| 4 | 1,018 | Los Angeles | CA | US Bank Tower |
| 5 | 1,002 | Houston | TX | JP Morgan Chase Tower |
| 6 | 973 | Philadelphia | PA | Comcast Center |
| 7 | 947 | Cleveland | OH | Hey Tower |
| 8 | 943 | Seattle | WA | Columbia Center |
| 9 | 871 | Charlotte | NC | Bank of America Corporate Center |
| 10 | 850 | Oklahoma City | OK | Devon Tower |
Top Ten List: The Shortest States
Here is what ranks as the tallest building for the “shortest” ten states (also includes D.C.):
| Rank | Height (ft) | City | State | Building Name |
|---|---|---|---|---|
| 42 | 320 | Wichita | KS | Epic Center |
| 43 | 296 | Anchorage | AK | Conoco Phillips Building |
| 44 | 293 | Charleston | WV | West Virginia State Capitol |
| 45 | 275 | Manchester | NH | City Hall Plaza |
| 46 | 272 | Billings | MT | First Interstate Center |
| 47 | 242 | Bismarck | ND | North Dakota State Capitol |
| 48 | 200 | Laramie | WY | White Hall |
| 49 | 175 | Portland | ME | Franklin Towers |
| 50 | 174 | Sioux Falls | SD | CenturyLink Tower |
| 51 | 124 | Burlington | VT | Decker Towers |
What is the Tallest Building in Each State?
Not surprisingly, about 76% of these highrises are office buildings, with one of every three named after a bank. However, the tallest buildings in some of states have pretty unique purposes. The tallest habitable building in D.C., for example, is the lengthily-named Basilica of the National Shrine of the Immaculate Conception, which is also the largest Roman Catholic church in North America.
The tallest building in Nevada is The Palazzo Resort Hotel Casino in Las Vegas. Meanwhile, the respective State Capitol buildings of North Dakota and West Virginia tower above any other skylines in those states.


VC+
VC+: Get Our Key Takeaways From the IMF’s World Economic Outlook
A sneak preview of the exclusive VC+ Special Dispatch—your shortcut to understanding IMF’s World Economic Outlook report.

Have you read IMF’s latest World Economic Outlook yet? At a daunting 202 pages, we don’t blame you if it’s still on your to-do list.
But don’t worry, you don’t need to read the whole April release, because we’ve already done the hard work for you.
To save you time and effort, the Visual Capitalist team has compiled a visual analysis of everything you need to know from the report—and our upcoming VC+ Special Dispatch will be available exclusively to VC+ members on Thursday, April 25th.
If you’re not already subscribed to VC+, make sure you sign up now to receive the full analysis of the IMF report, and more (we release similar deep dives every week).
For now, here’s what VC+ members can expect to receive.
Your Shortcut to Understanding IMF’s World Economic Outlook
With long and short-term growth prospects declining for many countries around the world, this Special Dispatch offers a visual analysis of the key figures and takeaways from the IMF’s report including:
- The global decline in economic growth forecasts
- Real GDP growth and inflation forecasts for major nations in 2024
- When interest rate cuts will happen and interest rate forecasts
- How debt-to-GDP ratios have changed since 2000
- And much more!

Get the Full Breakdown in the Next VC+ Special Dispatch
VC+ members will receive the full Special Dispatch on Thursday, April 25th.
Make sure you join VC+ now to receive exclusive charts and the full analysis of key takeaways from IMF’s World Economic Outlook.
Don’t miss out. Become a VC+ member today.
What You Get When You Become a VC+ Member
VC+ is Visual Capitalist’s premium subscription. As a member, you’ll get the following:
- Special Dispatches: Deep dive visual briefings on crucial reports and global trends
- Markets This Month: A snappy summary of the state of the markets and what to look out for
- The Trendline: Weekly curation of the best visualizations from across the globe
- Global Forecast Series: Our flagship annual report that covers everything you need to know related to the economy, markets, geopolitics, and the latest tech trends
- VC+ Archive: Hundreds of previously released VC+ briefings and reports that you’ve been missing out on, all in one dedicated hub
You can get all of the above, and more, by joining VC+ today.

-

 Markets1 week ago
U.S. Debt Interest Payments Reach $1 Trillion
-

 Markets2 weeks ago
Ranked: The Most Valuable Housing Markets in America
-

 Money2 weeks ago
Which States Have the Highest Minimum Wage in America?
-

 AI2 weeks ago
Ranked: Semiconductor Companies by Industry Revenue Share
-

 Markets2 weeks ago
Ranked: The World’s Top Flight Routes, by Revenue
-

 Demographics2 weeks ago
Population Projections: The World’s 6 Largest Countries in 2075
-

 Markets2 weeks ago
The Top 10 States by Real GDP Growth in 2023
-

 Money2 weeks ago
The Smallest Gender Wage Gaps in OECD Countries