Markets
Interactive Map: The Flow of International Trade
Click on a country to see its share of trade alone, or spin/navigate the globe by using your mouse.
Interactive: Mapping the Flow of International Trade
The interactive visualization you see in this post was created by data visualization expert Max Galka from the Metrocosm blog. (Also check out his new project, Blueshift, which allows users to upload data and visualize it on maps with no coding required.)
Trade is an essential part of economic prosperity, but how much do you know about global trade?
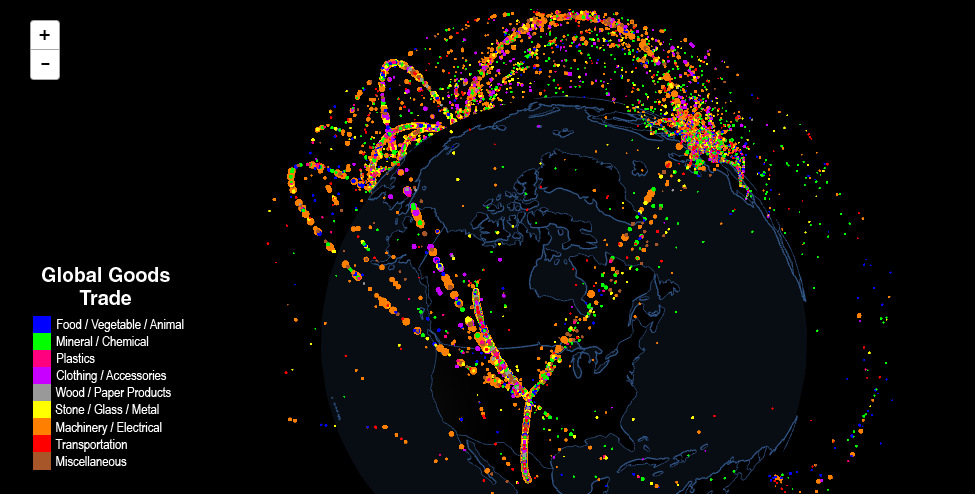
Today’s visualization helps to map international trade on a 3D globe, plotting the exchange of goods between countries. It enables the abstract concept of trade to become more tactile, and at the same time the visuals make it easier to absorb information.
Exploring the Map
The great thing about interactive maps is that they allow you to take control.
Here are a few things we found particularly interesting, as we scanned through the map:
- When looking at the globe as a whole, trade is concentrated into obvious hubs. The United States, Europe, and China/Japan are the most evident ones, and they are all lit up with color.
- There are also obvious have-nots. Take a look at most of the countries in Africa, or click on an individual country like North Korea to see a lack of international trade.
- In fact, North Korea is completely vacuous, except for one lonely dot floating to China every so often. After taking a quick look at the data, it seems China takes in over 60% of North Korea’s exports, which are mostly raw materials such as coal, iron ore, or pig iron.
- Now click on South Korea, and the situation is completely different. By the way, South Korea exports $583 billion of goods per year, while the hermit nation does just $3.1 billion per year.
- This map also shows how dependent some countries are on others for trade. Look at Canada, a country that sends close to 75% of its exports to the United States. Mexico has a similar situation, where it does most of its business with the U.S. as well.
- This is a stark contrast to Cuba, which doesn’t trade enough with any one partner to have it visualized on this scale at all. Cuba has exports of only $1.7 billion, and its largest trading partner is China, which only takes in $311 million of goods per year.
Want to see more on international trade? Check out this set of maps that shows China’s rising dominance in trade, or the flow of oil around the world.


Economy
The Most Valuable Companies in Major EU Economies
From semiconductor equipment manufacturers to supercar makers, the EU’s most valuable companies run the gamut of industries.
Most Valuable Companies in the EU, by Country
This was originally posted on our Voronoi app. Download the app for free on iOS or Android and discover incredible data-driven charts from a variety of trusted sources.
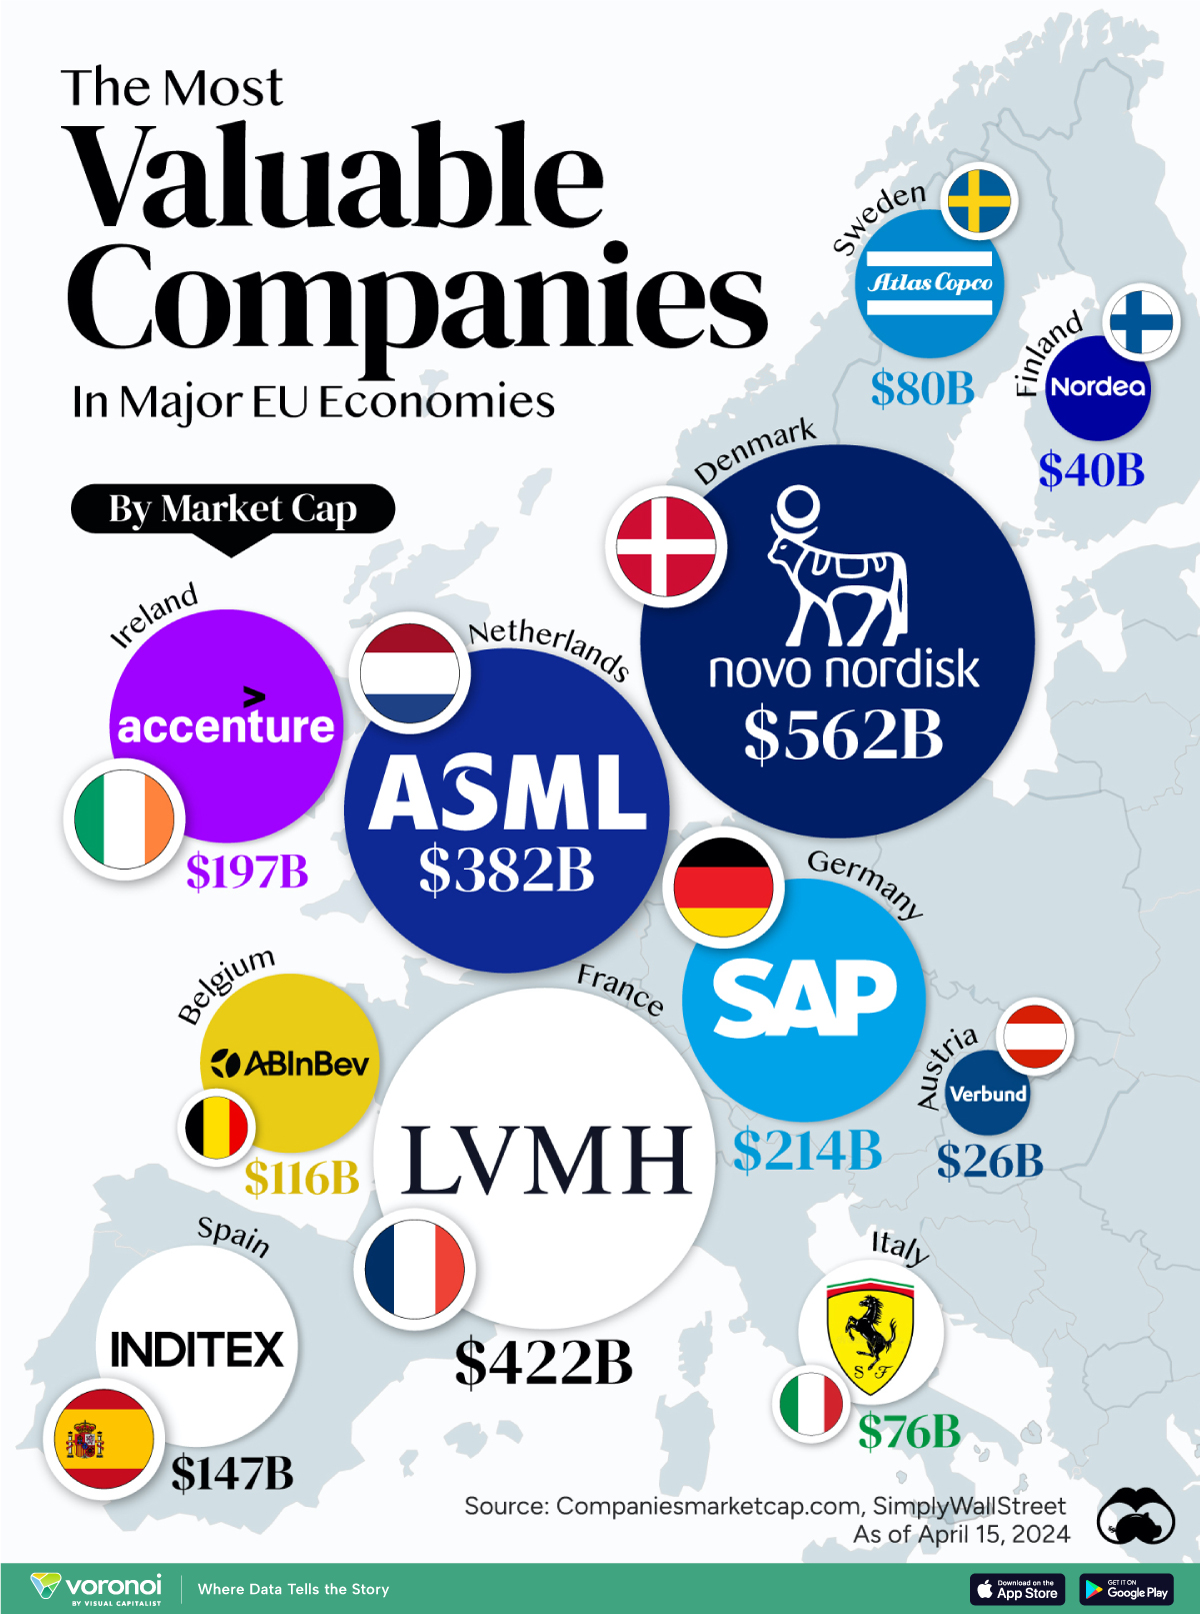
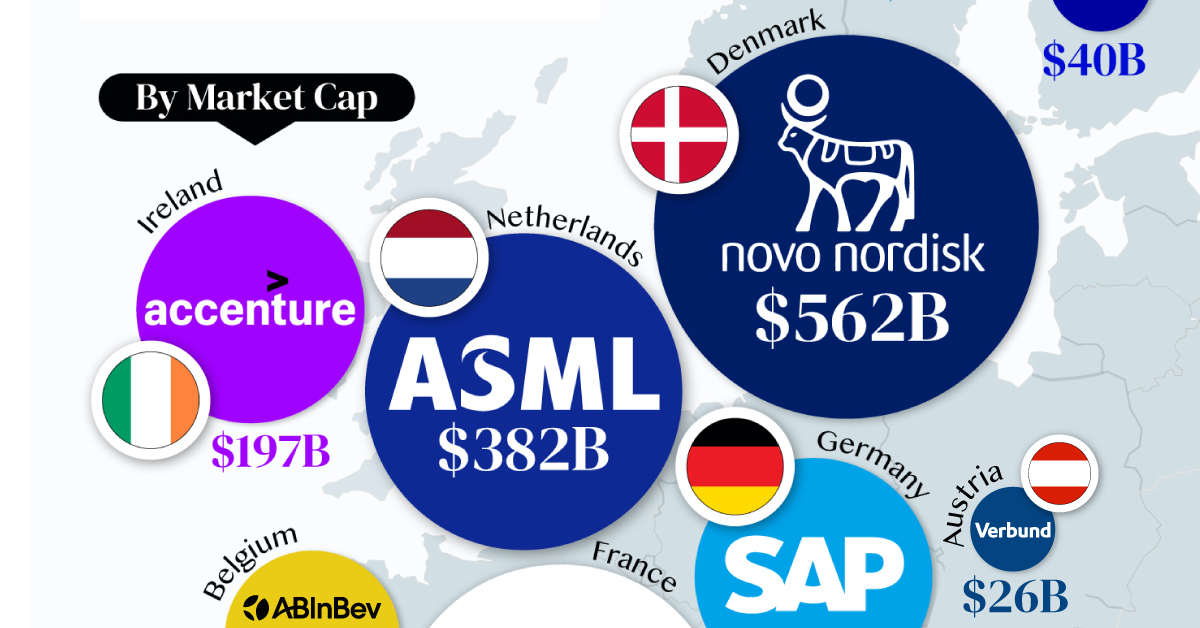
In this graphic, we mapped out the most valuable corporations in 11 major EU economies, based on their market capitalizations as of April 15th, 2024. All figures are in USD, and were sourced from Companiesmarketcap.com.
Novo Nordisk is currently worth more than $550 billion, making it Europe’s most valuable company by a wide margin. The pharmaceutical giant specializes in diabetes and weight-loss drugs. Demand for two of them, Ozempic and Wegovy, has surged due to their weight-loss capabilities, even causing nationwide shortages in the United States.
The following table includes an expanded list of the most valuable publicly-traded company in larger EU economies. Many of these were not included in the graphic due to space limitations.
| Country | Company | Sector | Market Cap |
|---|---|---|---|
| 🇩🇰 Denmark | 💊 Novo Nordisk | Pharmaceuticals | $562B |
| 🇫🇷 France | 👜 LVMH | Luxury Goods | $422B |
| 🇳🇱 Netherlands | 🔧 ASML | Semiconductor Equipment | $382B |
| 🇩🇪 Germany | 💼 SAP | Enterprise Software | $214B |
| 🇮🇪 Ireland | 🖥️ Accenture | IT Services | $197B |
| 🇪🇸 Spain | 👗 Inditex | Retail | $147B |
| 🇧🇪 Belgium | 🍻 Anheuser-Busch InBev | Beverages | $116B |
| 🇸🇪 Sweden | 🛠️ Atlas Copco | Industrial Equipment | $80B |
| 🇮🇹 Italy | 🏎️ Ferrari | Automotive | $76B |
| 🇫🇮 Finland | 🏦 Nordea Bank | Banking | $40B |
| 🇦🇹 Austria | 🔌 Verbund AG | Energy | $26B |
| 🇱🇺 Luxembourg | 🏗️ Tenaris | Oil & Gas Equipment | $22B |
| 🇨🇿 Czech Republic | 💡 CEZ Group | Energy | $20B |
| 🇵🇱 Poland | ⛽ PKN Orlen | Energy | $20B |
| 🇵🇹 Portugal | 🔌 EDP Group | Energy | $16B |
| 🇬🇷 Greece | 🏦 Eurobank | Banking | $7B |
| 🇭🇺 Hungary | ⛽ MOL Group | Energy | $7B |
| 🇭🇷 Croatia | 🏦 Zagrebacka Banka | Banking | $6B |
| 🇷🇴 Romania | ⛽ Romgaz | Energy | $4B |
| 🇸🇮 Slovenia | 💊 Krka | Pharmaceuticals | $4B |
Note: Figures are rounded and last updated on April 15th, 2024. Countries with top publicly-traded companies worth under $4 billion are excluded.
Luxury supergiant LVMH—which owns brands like Tiffany, Christian Dior, and TAG Heuer to name a few—is Europe’s second largest company by market cap, at $420 billion.
Rounding out the top three is ASML, which produces equipment crucial to chip manufacturers, worth $380 billion.
When looking at the region, there is a vast disparity between EU member states and their most valuable companies.
For example, as mentioned earlier, Denmark’s Novo Nordisk and France’s LVMH are worth between $400-550 billion each. Meanwhile, some countries don’t even have a single publicly-listed company that is worth over $1 billion.
In fact, only 12 EU countries (less than half of the union) are home to the top 100 most valuable companies within the bloc. An additional four countries are represented if you look at the list of the top 200 companies.

-

 Technology6 days ago
All of the Grants Given by the U.S. CHIPS Act
-

 Uranium2 weeks ago
The World’s Biggest Nuclear Energy Producers
-

 Education2 weeks ago
How Hard Is It to Get Into an Ivy League School?
-

 Debt2 weeks ago
How Debt-to-GDP Ratios Have Changed Since 2000
-

 Sports2 weeks ago
The Highest Earning Athletes in Seven Professional Sports
-

 Science2 weeks ago
Visualizing the Average Lifespans of Mammals
-

 Brands1 week ago
How Tech Logos Have Evolved Over Time
-

 Energy1 week ago
Ranked: The Top 10 EV Battery Manufacturers in 2023