Green
Visualized: Historical Trends in Global Monthly Surface Temperatures (1851-2020)
View the full-resolution version of this infographic
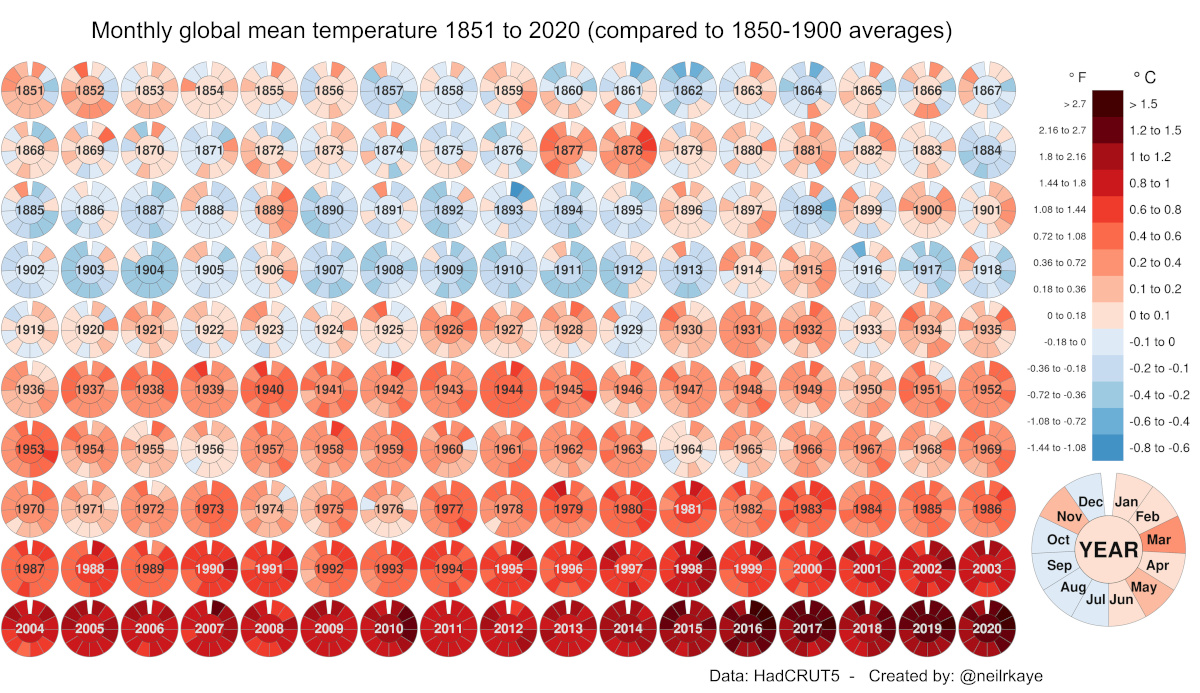
Global Temperature Graph (1851-2020)
View the high-resolution of the infographic by clicking here.
Since 1880, the Earth’s average surface temperature has risen by 0.07°C (0.13°F) every decade. That number alone may seem negligible, but over time, it adds up.
In addition, the rate of temperature change has grown significantly more dramatic over time—more than doubling to 0.18°C (0.32°F) since 1981. As a result of this global warming process, environmental crises have become the most prominent risks of our time.
In this global temperature graph, climate data scientist Neil R. Kaye breaks down how monthly average temperatures have changed over nearly 170 years. Temperature values have been benchmarked against pre-industrial averages (1850–1900).
What is Causing Global Warming?
The data visualization can be thought of in two halves, each reflecting significant trigger points in global warming trends:
- 1851-1935
Overlaps with the Second Industrial Revolution
Low-High range in global temperature increase: -0.4°C to +0.6°C - 1936-2020
Overlaps with the Third Industrial Revolution
Low-High range in global temperature increase: +0.6°C to +1.5°C and up
The global temperature graph makes it clear that for several years now, average surface temperatures have consistently surpassed 1.5°C above their pre-industrial values. Let’s dig into these time periods a bit more closely to uncover more context around this phenomenon.
Industrial Revolutions and Advances, 1851–1935
An obvious, early anomaly on the visual worth exploring occurs between 1877–1878. During this time, the world experienced numerous unprecedented climate events, from a strong El Niño to widespread droughts. The resulting Great Famine caused the deaths of between 19–50 million people, even surpassing some of the deadliest pandemics in history.
In the first five rows of the global temperature graph, several economies progressed into the Second Industrial Revolution (~1870–1914), followed by World War I (1914-1918). Overall, there was a focus on steel production and mass-produced consumer goods over these 80+ years.
Although these technological advances brought immense improvements, they came at the cost of burning fossil fuels—releasing significant amounts of carbon dioxide and other greenhouse gases. It would take several more decades before scientists realized the full extent of their accumulation in the atmosphere, and their resulting relation to global warming.
The Modern World In the Red Zone, 1936–2020
The second half of the global temperature graph is marked by World War II (1939-1945) and its aftermath. As the dust settled, nations began to build themselves back up, and things really kicked into hyperdrive with the Third Industrial Revolution.
As globalization and trade progressed following the 1950s, people and goods began moving around more than ever before. In addition, population growth peaked at 2.1% per year between 1965 and 1970. Industrialization patterns began to intensify further to meet the demands of a rising global population and our modern world.
The Importance of Historical Temperature Trends
The history of human development is intricately linked with global warming. While part of the rise in Earth’s surface temperature can be attributed to natural patterns of climate change, these historical trends shed some light on how much human activities are behind the rapid increase in global average temperatures in the last 85 years.
The following video from Reddit user bgregory98, which leverages an extensive data set published in Nature Geoscience provides a more dramatic demonstration. It looks at the escalation of global temperatures over two thousand years. In this expansive time frame, eight of the top ten hottest years on record have occurred in the last decade alone.
Global warming and climate change are some of the most pressing megatrends shaping our future. However, with the U.S. rejoining the Paris Climate Agreement, and the reduction of global carbon emissions highlighted as a key item at the World Economic Forum’s Davos Summit 2021, promising steps are being taken.


Green
How Carbon Credits Can Help Close the Climate Funding Gap
To keep a 1.5℃ world within reach, global emissions need to fall by as much as 45% by 2030, and carbon credits could help close the gap.


How Carbon Credits Can Help Close the Climate Funding Gap
Governments around the world have committed to the goals of the Paris Agreement, but their climate pledges are insufficient. To keep a 1.5℃ world within reach, global emissions need to fall by as much as 45% by 2030.
Bold and immediate action is essential, but so are resources that will make it happen.
In this graphic, we have partnered with Carbon Streaming to look at the role that the voluntary carbon market and carbon credits can play in closing that gap.
More Funds are Needed for Climate Finance
According to data from the Climate Policy Initiative, climate finance, which includes funds for both adaptation and mitigation, needs to increase at least five-fold, from $1.3T in 2021/2022, to an average $8.6T annually until 2030, and then to just over $10T in the two decades leading up to 2050.
That adds up to a very large number, but consider that in 2022, $7.0T went to fossil fuel subsidies, which almost covers the annual estimated outlay. And the world has shown that when pressed, governments can come up with the money, if the global pandemic is any indication.
Mobilizing Carbon Finance to the Developing World
But the same cannot be said of the developing world, where debt, inequality, and poverty reduce the ability of governments to act. And this is where carbon credits can play an important role. According to analyses from Ecosystem Marketplace, carbon credits help move capital from developed countries, to where funds are needed in the developing world.
For example, in 2019, 69.2% of the carbon credits by volume in the voluntary carbon market were purchased by buyers in Europe, and nearly a third from North America. Compare that to over 90% of the volume of carbon credits sold in the voluntary carbon market in 2022 came from projects that were located outside of those two regions.
Carbon Credits Can Complement Decarbonization Efforts
Carbon credits can also complement decarbonization efforts in the corporate world, where more and more companies have been signing up to reduce emissions. According to the 2022 monitoring report from the Science Based Targets initiative, 4,230 companies around the world had approved targets and commitments, which represented an 88% increase from the prior year. However, as of year end 2022, combined scope 1 and 2 emissions covered by science-based targets totaled approximately 2 GtCO2e, which represents just a fraction of global emissions.
The fine print is that this is just scope 1 and 2 emissions, and doesn’t include scope 3 emissions, which can account for more than 70% of a company’s total emissions. And as these emissions come under greater and greater scrutiny the closer we get to 2030 and beyond, the voluntary carbon credit market could expand exponentially to help meet the need to compensate for these emissions.
Potential Carbon Credit Market Size in 2030
OK, but how big? In 2022, the voluntary carbon credit market was around $2B, but some analysts predict that it could grow to between $5–250 billion by 2030.
| Firm | Low Estimate | High Estimate |
|---|---|---|
| Bain & Company | $15B | $30B |
| Barclays | N/A | $250B |
| Citigroup | $5B | $50B |
| McKinsey & Company | $5B | $50B |
| Morgan Stanley | N/A | $100B |
| Shell / Boston Consulting Group | $10B | $40B |
Morgan Stanley and Barclays were the most bullish on the size of the voluntary carbon credit market in 2030, but the latter firm was even more optimistic about 2050, and predicted that the voluntary carbon credit market could grow to a colossal $1.5 trillion.
Carbon Streaming is Focused on Carbon Credit Integrity
Ultimately, carbon credits could have an important role to play in marshaling the resources needed to keep the world on track to net zero by 2050, and avoiding the worst consequences of a warming world.
Carbon Streaming uses streaming transactions, a proven and flexible funding model, to scale high-integrity carbon credit projects to advance global climate action and UN Sustainable Development Goals.
Learn more at www.carbonstreaming.com.

-

 Green1 week ago
Ranking the Top 15 Countries by Carbon Tax Revenue
This graphic highlights France and Canada as the global leaders when it comes to generating carbon tax revenue.
-

 Green1 week ago
Ranked: The Countries With the Most Air Pollution in 2023
South Asian nations are the global hotspot for pollution. In this graphic, we rank the world’s most polluted countries according to IQAir.
-

 Environment2 weeks ago
Top Countries By Forest Growth Since 2001
One country is taking reforestation very seriously, registering more than 400,000 square km of forest growth in two decades.
-

 Green3 weeks ago
Ranked: Top Countries by Total Forest Loss Since 2001
The country with the most forest loss since 2001 lost as much forest cover as the next four countries combined.
-

 Markets2 months ago
The World’s Top Cocoa Producing Countries
Here are the largest cocoa producing countries globally—from Côte d’Ivoire to Brazil—as cocoa prices hit record highs.
-

 Environment2 months ago
Charted: Share of World Forests by Country
We visualize which countries have the biggest share of world forests by area—and while country size plays a factor, so too, does the environment.


-

 Mining1 week ago
Gold vs. S&P 500: Which Has Grown More Over Five Years?
-

 Markets2 weeks ago
Ranked: The Most Valuable Housing Markets in America
-

 Money2 weeks ago
Which States Have the Highest Minimum Wage in America?
-

 AI2 weeks ago
Ranked: Semiconductor Companies by Industry Revenue Share
-

 Markets2 weeks ago
Ranked: The World’s Top Flight Routes, by Revenue
-

 Countries2 weeks ago
Population Projections: The World’s 6 Largest Countries in 2075
-

 Markets2 weeks ago
The Top 10 States by Real GDP Growth in 2023
-

 Demographics2 weeks ago
The Smallest Gender Wage Gaps in OECD Countries