Markets
From Novelty to Necessity: The Growing Tiny Home Movement

Visualizing the Rise of Tiny Homes
Born out of the desire for a simpler, more affordable way of life, the tiny home movement has spread at a furious pace—with the global market estimated to grow by a CAGR of almost 7%, adding nearly $5.2 billion in market size by 2022.
Given the economic pressures of today’s world, these alternative housing solutions have become not only a viable option for many people, but a vital one.
Today’s infographic from Calculator.me illustrates how the tiny home market got so big, and how it fares against traditional housing when it comes to providing environmentally friendly and affordable options.
How Did Tiny Homes Get So Big?
It was not until the 2009 recession hit the U.S. that tiny homes became more of a realistic option, as the benefits of downscaling became more apparent.
From then on, three things propelled the popularity of tiny homes: rising house costs, shrinking incomes, and a greater consideration for the environment.
Today, 63% of U.S. millennials would consider living in a tiny home. However, the need to go tiny is not only confined to millennials, as 40% of tiny home owners are over fifty years old.
Tiny Vs. Traditional
According to the infographic, a home is considered tiny (or micro) when it is between 80-400ft², and is at least 8ft in height.
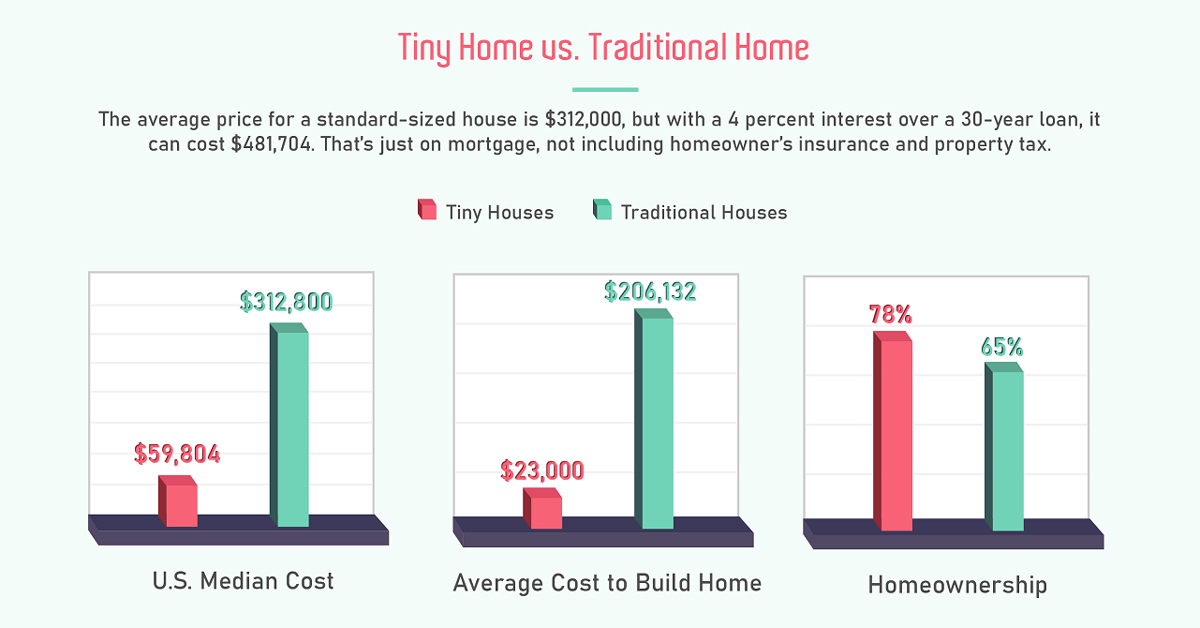
Tiny homes also come with a tiny pricetag, costing just $23,000 on average to build—meaning tiny homes are almost ⅒ the price of traditional homes.
| Metric | Tiny Homes | Traditional Homes |
|---|---|---|
| U.S. Median Cost | $59,884 | $312,800 |
| Average Cost To Build | $23,000 | $206,132 |
| Home Ownership | 78% own their home | 65% own their home |
| Mortgage | 32% have a mortgage | 64.1% have a mortgage |
| Credit Card Debt | 40% have credit card debt | 37% have credit card debt |
Other benefits of tiny home living include:
- Avoiding mortgage debt
- Less maintenance required
- Allows for a more flexible lifestyle
Further, tiny homes are providing people with alternative solutions for more sustainable living.
An Environmentally Friendly Way of Living
Certain models of tiny homes use energy from solar panels—presenting ample opportunities for an independent off-grid lifestyle. Moreover, research from Virginia Tech shows that living in tiny homes reduces energy consumption by up to 45%.
Using less energy can also be attributed to tiny homeowners using the space outside as an extension of their home. In fact, when there is usable space available outdoors, tiny home living may not seem as drastic in comparison to living in a traditional home.
Room For Improvement
There are however, some challenges for those who are considering this way of life. Zoning laws and building codes in the U.S. can be restrictive, with some states more supportive of the idea than others.
Despite these barriers, there are numerous organizations and initiatives that have been created in order to eliminate the pain points that come with tiny homes, and legitimize the industry.
Not Just a Passing Trend
With the promising trajectory of tiny homes, it is inevitable that the interest from global retailers continues to grow.
Japanese minimalist company, Muji, released their own tiny homes in 2017, costing $26,000 on average. At just under 107.6 ft², these tiny homes are prefabricated, meaning they are constructed in a factory off-site.
Amazon also recently announced their foray into the tiny home space, with dozens of models available on their website—delivering new homes right to their customers’ front doors.
The Future Comes in All Shapes and Sizes
Beyond the typical tiny home formats we see entering the market en masse, there are other alternatives which will become more readily available to consumers, including:
- Traditional modular homes
- Shipping containers
- 3D printed houses
- Recreational vehicles
It is also worth pointing out that tiny homes and these alternative models don’t have to be restricted to under 400ft². Flat packs and do-it-yourself tiny homes can be as big as 1,000ft², with some of the largest models housing up to 24 people.
It is clear that the tiny home movement is not just about going back to basics, but rather, about making home ownership a reality for everyone—potentially disrupting the current housing market in the process.
The question is not if tiny homes will become the new normal, but when.


Markets
The European Stock Market: Attractive Valuations Offer Opportunities
On average, the European stock market has valuations that are nearly 50% lower than U.S. valuations. But how can you access the market?


European Stock Market: Attractive Valuations Offer Opportunities
Europe is known for some established brands, from L’Oréal to Louis Vuitton. However, the European stock market offers additional opportunities that may be lesser known.
The above infographic, sponsored by STOXX, outlines why investors may want to consider European stocks.
Attractive Valuations
Compared to most North American and Asian markets, European stocks offer lower or comparable valuations.
| Index | Price-to-Earnings Ratio | Price-to-Book Ratio |
|---|---|---|
| EURO STOXX 50 | 14.9 | 2.2 |
| STOXX Europe 600 | 14.4 | 2 |
| U.S. | 25.9 | 4.7 |
| Canada | 16.1 | 1.8 |
| Japan | 15.4 | 1.6 |
| Asia Pacific ex. China | 17.1 | 1.8 |
Data as of February 29, 2024. See graphic for full index names. Ratios based on trailing 12 month financials. The price to earnings ratio excludes companies with negative earnings.
On average, European valuations are nearly 50% lower than U.S. valuations, potentially offering an affordable entry point for investors.
Research also shows that lower price ratios have historically led to higher long-term returns.
Market Movements Not Closely Connected
Over the last decade, the European stock market had low-to-moderate correlation with North American and Asian equities.
The below chart shows correlations from February 2014 to February 2024. A value closer to zero indicates low correlation, while a value of one would indicate that two regions are moving in perfect unison.
| EURO STOXX 50 | STOXX EUROPE 600 | U.S. | Canada | Japan | Asia Pacific ex. China |
|
|---|---|---|---|---|---|---|
| EURO STOXX 50 | 1.00 | 0.97 | 0.55 | 0.67 | 0.24 | 0.43 |
| STOXX EUROPE 600 | 1.00 | 0.56 | 0.71 | 0.28 | 0.48 | |
| U.S. | 1.00 | 0.73 | 0.12 | 0.25 | ||
| Canada | 1.00 | 0.22 | 0.40 | |||
| Japan | 1.00 | 0.88 | ||||
| Asia Pacific ex. China | 1.00 |
Data is based on daily USD returns.
European equities had relatively independent market movements from North American and Asian markets. One contributing factor could be the differing sector weights in each market. For instance, technology makes up a quarter of the U.S. market, but health care and industrials dominate the broader European market.
Ultimately, European equities can enhance portfolio diversification and have the potential to mitigate risk for investors.
Tracking the Market
For investors interested in European equities, STOXX offers a variety of flagship indices:
| Index | Description | Market Cap |
|---|---|---|
| STOXX Europe 600 | Pan-regional, broad market | €10.5T |
| STOXX Developed Europe | Pan-regional, broad-market | €9.9T |
| STOXX Europe 600 ESG-X | Pan-regional, broad market, sustainability focus | €9.7T |
| STOXX Europe 50 | Pan-regional, blue-chip | €5.1T |
| EURO STOXX 50 | Eurozone, blue-chip | €3.5T |
Data is as of February 29, 2024. Market cap is free float, which represents the shares that are readily available for public trading on stock exchanges.
The EURO STOXX 50 tracks the Eurozone’s biggest and most traded companies. It also underlies one of the world’s largest ranges of ETFs and mutual funds. As of November 2023, there were €27.3 billion in ETFs and €23.5B in mutual fund assets under management tracking the index.
“For the past 25 years, the EURO STOXX 50 has served as an accurate, reliable and tradable representation of the Eurozone equity market.”
— Axel Lomholt, General Manager at STOXX
Partnering with STOXX to Track the European Stock Market
Are you interested in European equities? STOXX can be a valuable partner:
- Comprehensive, liquid and investable ecosystem
- European heritage, global reach
- Highly sophisticated customization capabilities
- Open architecture approach to using data
- Close partnerships with clients
- Part of ISS STOXX and Deutsche Börse Group
With a full suite of indices, STOXX can help you benchmark against the European stock market.
Learn how STOXX’s European indices offer liquid and effective market access.

-

 Economy2 days ago
Economic Growth Forecasts for G7 and BRICS Countries in 2024
The IMF has released its economic growth forecasts for 2024. How do the G7 and BRICS countries compare?
-

 Markets1 week ago
U.S. Debt Interest Payments Reach $1 Trillion
U.S. debt interest payments have surged past the $1 trillion dollar mark, amid high interest rates and an ever-expanding debt burden.
-

 United States2 weeks ago
Ranked: The Largest U.S. Corporations by Number of Employees
We visualized the top U.S. companies by employees, revealing the massive scale of retailers like Walmart, Target, and Home Depot.
-

 Markets2 weeks ago
The Top 10 States by Real GDP Growth in 2023
This graphic shows the states with the highest real GDP growth rate in 2023, largely propelled by the oil and gas boom.
-

 Markets2 weeks ago
Ranked: The World’s Top Flight Routes, by Revenue
In this graphic, we show the highest earning flight routes globally as air travel continued to rebound in 2023.
-

 Markets2 weeks ago
Ranked: The Most Valuable Housing Markets in America
The U.S. residential real estate market is worth a staggering $47.5 trillion. Here are the most valuable housing markets in the country.


-

 Mining1 week ago
Gold vs. S&P 500: Which Has Grown More Over Five Years?
-
Markets2 weeks ago
Ranked: The Most Valuable Housing Markets in America
-

 Money2 weeks ago
Which States Have the Highest Minimum Wage in America?
-

 AI2 weeks ago
Ranked: Semiconductor Companies by Industry Revenue Share
-
Markets2 weeks ago
Ranked: The World’s Top Flight Routes, by Revenue
-

 Demographics2 weeks ago
Population Projections: The World’s 6 Largest Countries in 2075
-
Markets2 weeks ago
The Top 10 States by Real GDP Growth in 2023
-

 Demographics2 weeks ago
The Smallest Gender Wage Gaps in OECD Countries