Energy
Visualizing EV Production in the U.S. by Brand


Visualizing EV Production in the U.S. by Brand
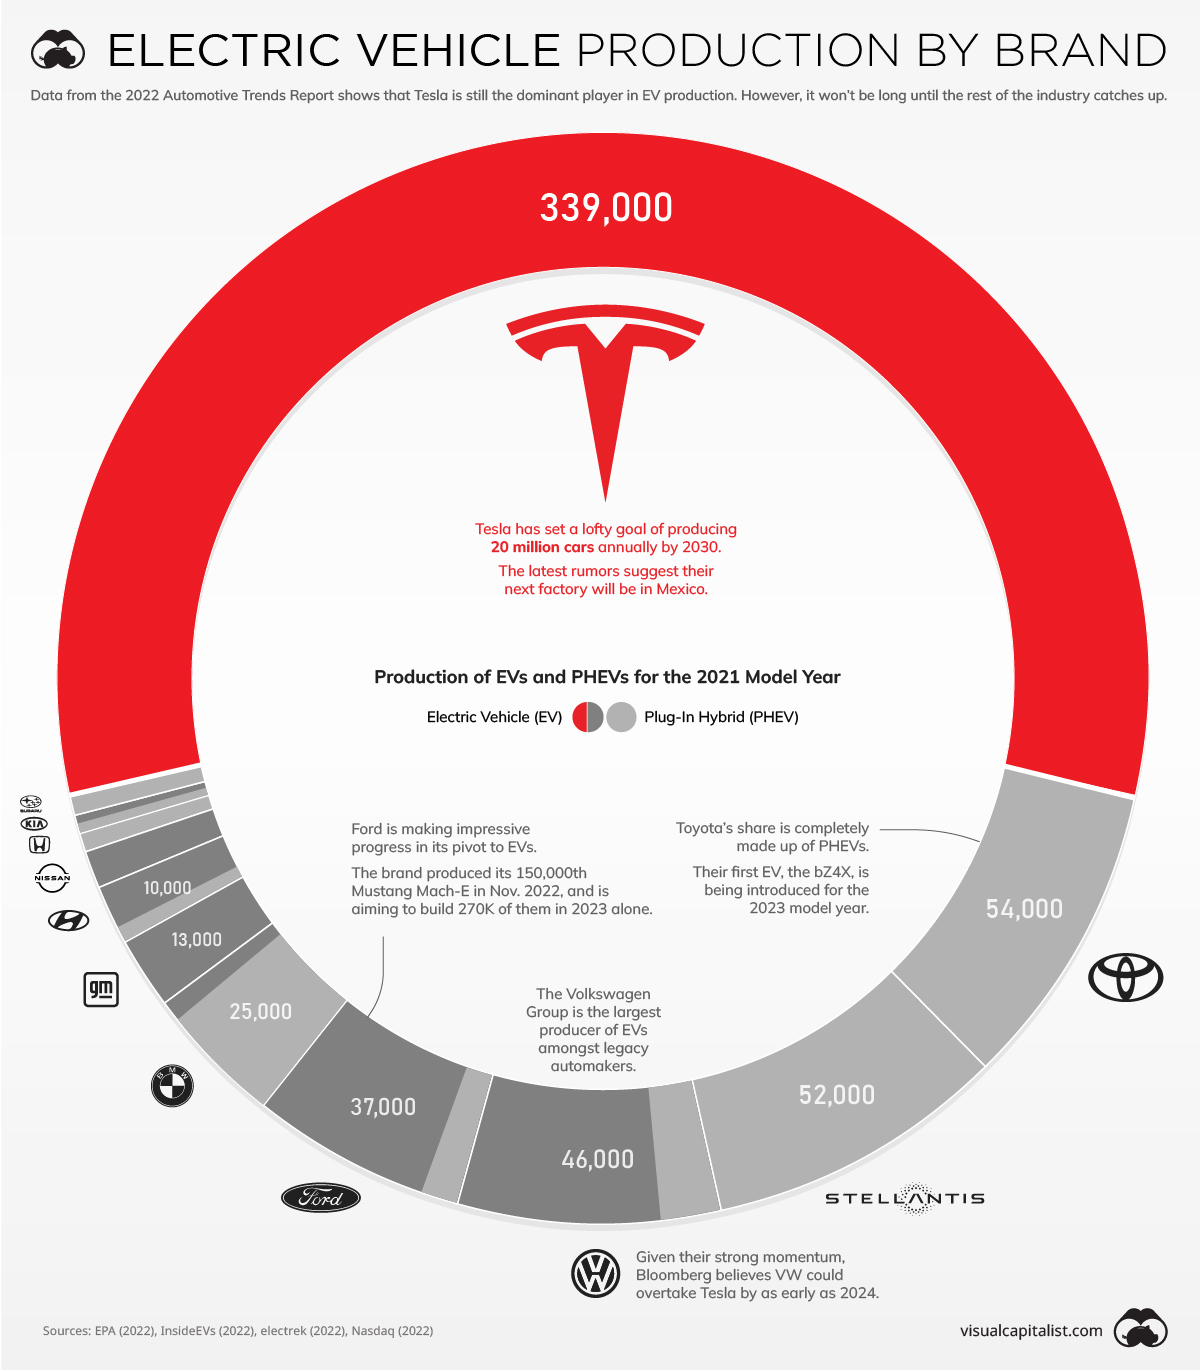
How long will Tesla hold onto its dominant electric vehicle (EV) market share?
This is one of the biggest questions facing the U.S. automotive industry. On one hand, Tesla has a very strong brand and loyal customer base (similar to Apple). The company also has a headstart in EV production and spends more on R&D per car than its competitors.
On the other hand, legacy automakers such as Volkswagen are eager to overtake Tesla. As the incumbents, they have decades more experience in building cars and are investing billions of dollars to catch up.
To keep you up to date on this evolving story, we’ve visualized data from the EPA’s 2022 Automotive Trends Report.
Data for the 2021 Model Year
Although it comes from a 2022 report, the comprehensive production data used in this infographic is for the 2021 model year.
The table below breaks out total production by EV and PHEV (plug-in hybrid electric vehicle).
| Manufacturer | EV Production | PHEV Production | Combined Production |
|---|---|---|---|
| GM | 13,000 | 0 | 13,000 |
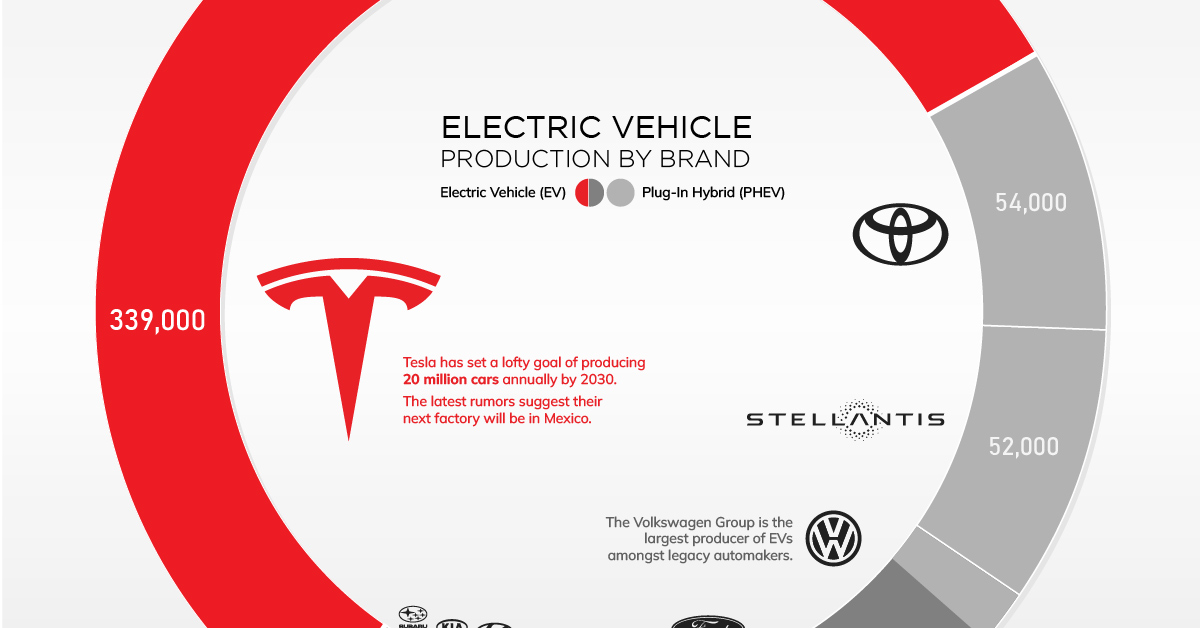
| Toyota | 0 | 54,000 | 54,000 |
| VW | 37,000 | 9,000 | 46,000 |
| BMW | 2,000 | 22,000 | 25,000 |
| Honda | 0 | 2,000 | 2,000 |
| Tesla | 339,000 | 0 | 339,000 |
| Mazda | 0 | 0 | 0 |
| Hyundai | 8,000 | 2,000 | 10,000 |
| Subaru | 0 | 2,000 | 2,000 |
| Mercedes | 0 | 0 | 0 |
| Stellantis | 0 | 52,000 | 52,000 |
| Kia | 1,000 | 1,000 | 2,000 |
| Nissan | 6,000 | 0 | 6,000 |
| Ford | 32,000 | 5,000 | 37,000 |
| Total* | 438,000 | 149,000 | 588,000 |
*Rounded to nearest 1,000. Numbers may not add up due to rounding. Includes top 14 manufacturers with U.S. footprint
Toyota and Stellantis are the two biggest legacy automakers in this dataset, though it’s worth pointing out that they only produced PHEVs. Toyota’s first EV, the bZ4X, isn’t slated for release until 2023.
Stellantis appears to be even further behind, though the company has plenty of untapped potential with brands like Jeep and Ram. In a recent interview, Stellantis CEO Carlos Tavares revealed that the company has set aside $36 billion for electrification and software.
Legacy Brands with the Most Momentum
When it comes to building EVs, some legacy brands have moved quicker than others.
Among these legacy brands is Volkswagen, which has made a major commitment to EVs in the fallout of its Dieselgate scandal. The group aims to produce 22 million EVs by 2028, and is rolling out various models including the ID.3 hatchback, the ID.4 SUV, and the ID. Buzz (an electric revival of the classic Microbus).
Ford is also showing good pace, announcing $22 billion in EV investment between 2021 and 2025. The brand produced its 150,000th Mustang Mach-E in Nov. 2022, and is aiming to build 270,000 of them in 2023 alone.
Ford’s highly anticipated F-150 Lightning has also received over 200,000 reservations. Production of the Lightning is expected to be 15,000 in 2022, 55,000 in 2023, and 80,000 in 2024. Rivian, Ford’s primary rival in the electric pickup truck segment, is on track to reach 25,000 vehicles in 2022.


Energy
Mapped: The Age of Energy Projects in Interconnection Queues, by State
This map shows how many energy projects are in interconnection queues by state and how long these projects have been queued up, on average.


Age of Energy Projects in Interconnection Queues, by State
This was originally posted on our Voronoi app. Download the app for free on iOS or Android and discover incredible data-driven charts from a variety of trusted sources.
By the end of 2023, more than 11,000 energy projects were in interconnection queues in the United States, waiting for a green-light from regional grid operators to proceed with construction.
This map, created in partnership with the National Public Utilities Council, maps out the average age of active energy projects in interconnection queues by state, using data from Berkeley Lab.
Interconnection Queues, Explained
Interconnection queues are lists of energy projects that have made interconnection requests to their regional grid operators. Once submitted, these requests formally initiate the impact study process that each project goes through before grid connection, forming waiting lists for approval known as interconnection queues.
In recent years, both the number and generation capacity of queued projects have surged in the United States, along with the length of time spent in queue.
According to Berkeley Lab, the amount of generation capacity entering queues each year has risen by more than 550% from 2015 to 2023, with average queue duration rising from 3 years to 5 years the same period.
As a result of the growing backlog, a large proportion of projects ultimately withdraw from queues, leading to only 19% of applications reaching commercial operations.
The Backlog: Number of Projects and Average Wait Times
Of the 11,000 active projects in U.S. queues at the end of 2023, Texas, California, and Virginia had the most in queue; 1,208, 947, and 743, respectively.
When looking at the average ages of these projects, all three states hovered around the national average of 34 months (2.83 years), with Texas sporting 28 months, California 33, and Virginia 34.
Vermont, Minnesota, Wisconsin, and Florida, on the other hand, had the highest average queue durations; 54, 49, 47, and 46 months, respectively.
Average Queue Duration by Project Type
At the end of 2023, more than 95% of the generation capacity in active interconnection queues was for emission-free resources. The table below provides a breakdown.
| Project Type | Average Queue Duration (As of 12/31/2023) | Number of Projects in Queue |
|---|---|---|
| Wind | 40 months | 841 |
| Solar | 34 months | 4,506 |
| Wind+Battery | 34 months | 76 |
| Solar+Battery | 27 months | 2,377 |
| Battery | 24 months | 2,818 |
Wind projects had the highest wait times at the end of 2023 with an average age of 40 months (3.33 years). Solar projects, on the other hand, made up more than 40% of projects in queue.
Overall, reducing the time that these renewable energy projects spend in queues can accelerate the transition to a low-carbon energy future.
According to the U.S. Department of Energy, enhancing data transparency, streamlining approval processes, promoting economic efficiency, and maintaining a reliable grid are some of the ways this growing backlog can be mitigated.

-

 Culture7 days ago
The World’s Top Media Franchises by All-Time Revenue
-

 Science2 weeks ago
Visualizing the Average Lifespans of Mammals
-

 Brands2 weeks ago
How Tech Logos Have Evolved Over Time
-

 Energy2 weeks ago
Ranked: The Top 10 EV Battery Manufacturers in 2023
-

 Countries2 weeks ago
Countries With the Largest Happiness Gains Since 2010
-

 Economy2 weeks ago
VC+: Get Our Key Takeaways From the IMF’s World Economic Outlook
-

 Demographics2 weeks ago
The Countries That Have Become Sadder Since 2010
-

 Money1 week ago
Charted: Who Has Savings in This Economy?