Demographics
Charted: The World’s Working Poor, by Country (1991-2021)
Article/Editing:
Charting Three Decades of the World’s Working Poor
Poverty is often associated with unemployment—however, millions of working people around the world are living in what’s considered to be extreme poverty, or less than $1.90 per day.
Thankfully, the world’s population of poor workers has decreased substantially over the last few decades. But how exactly has it changed since 1991, and where is the majority of the working poor population living today?
This graphic by Gilbert Fontana uses data from the International Labour Organization (ILO) to show the regional breakdown of the world’s working poor, and how this demographic has changed in the last few decades.
From Asia to Africa
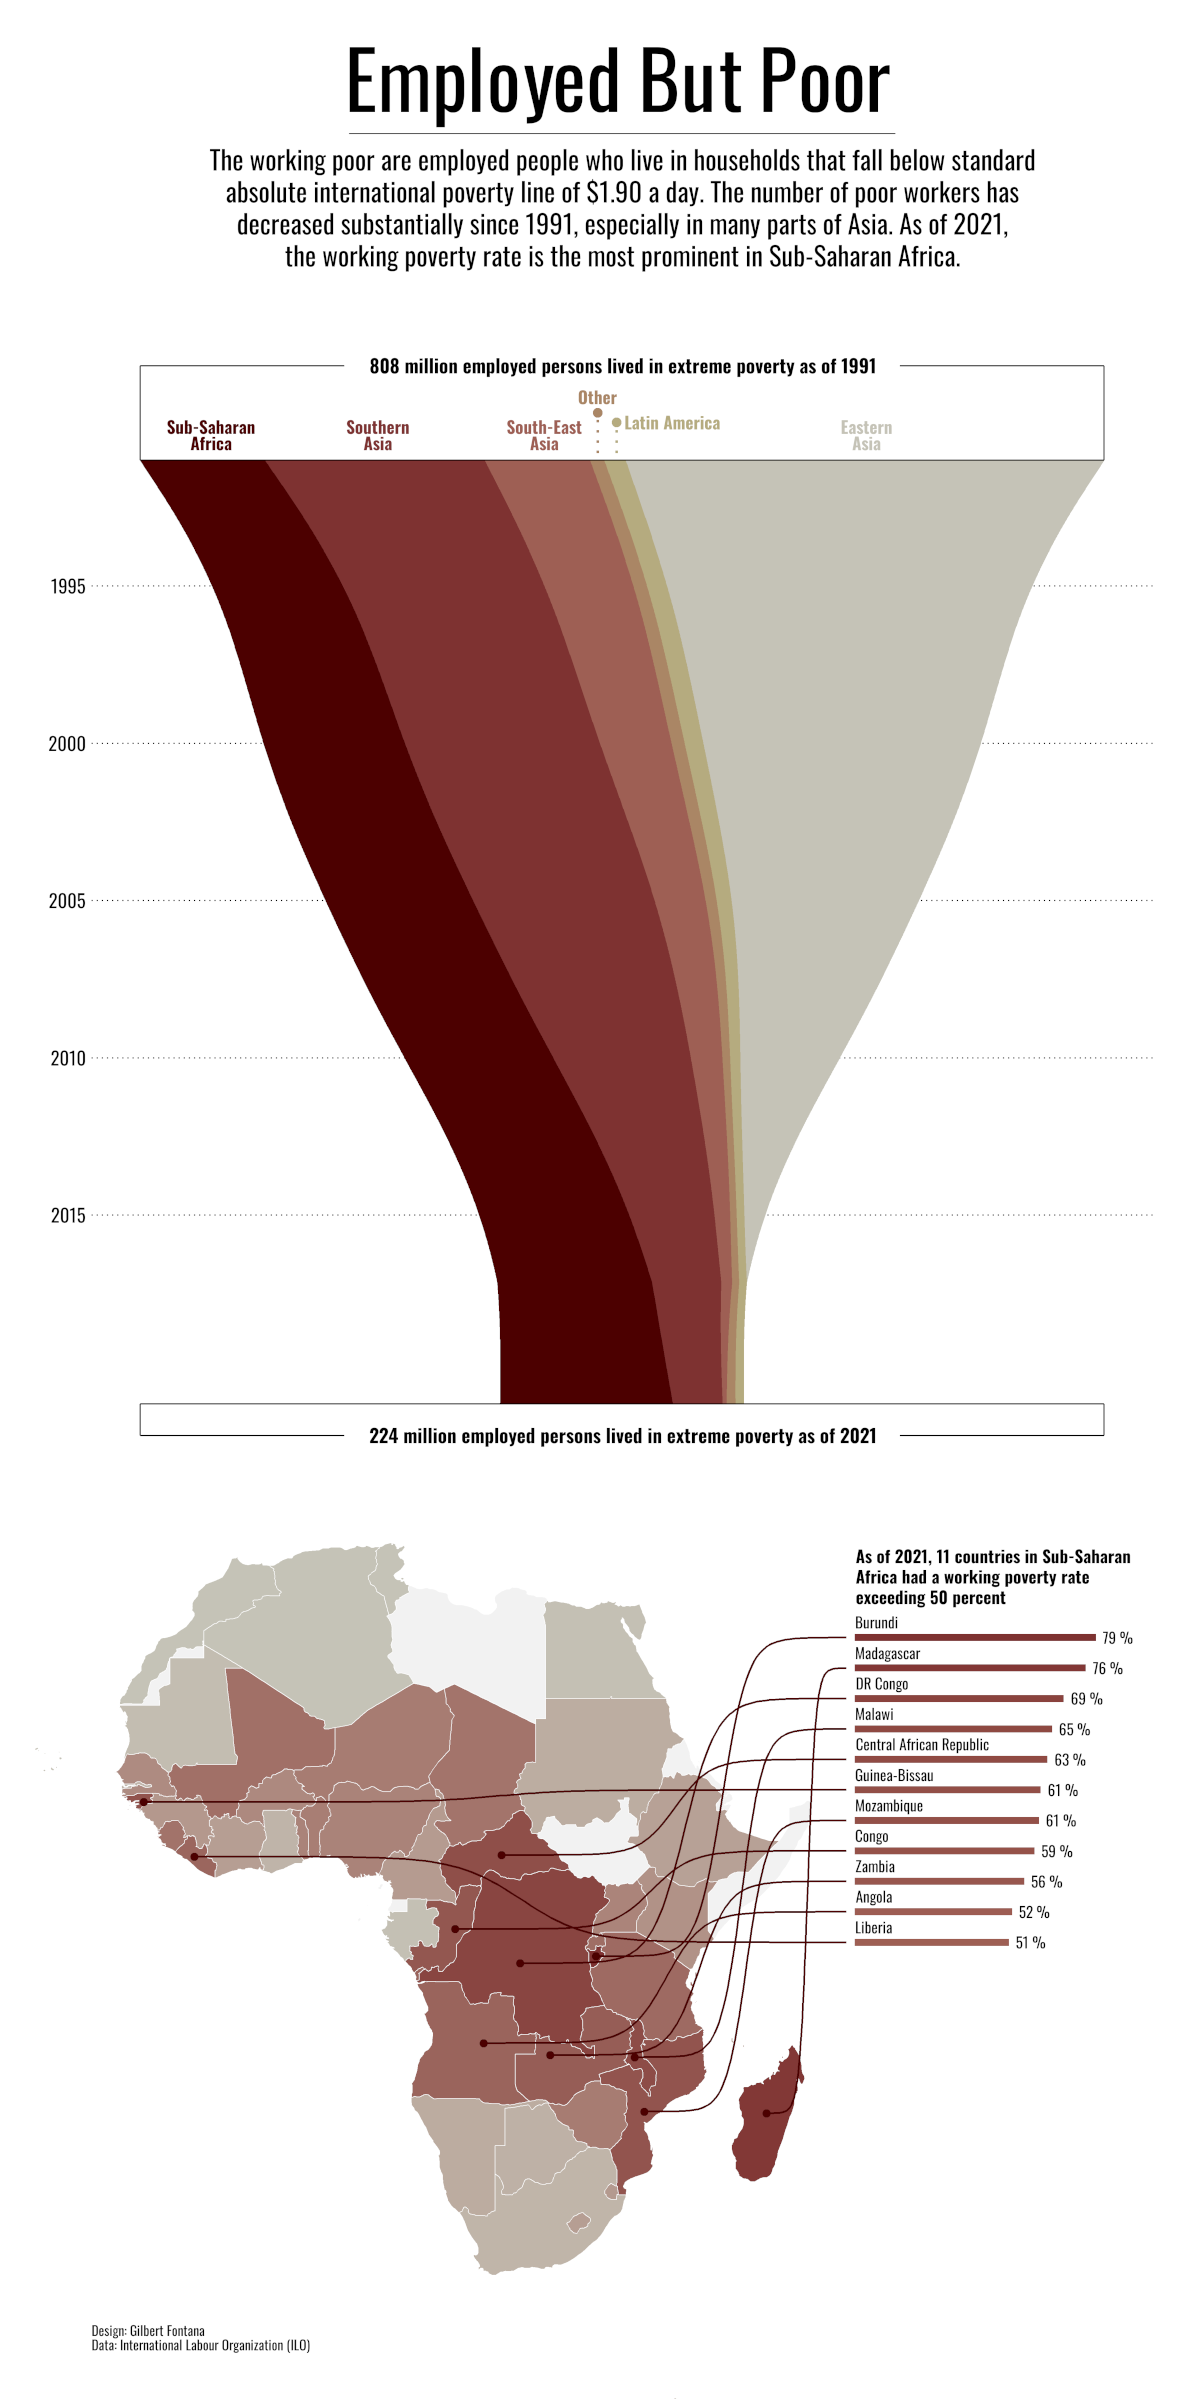
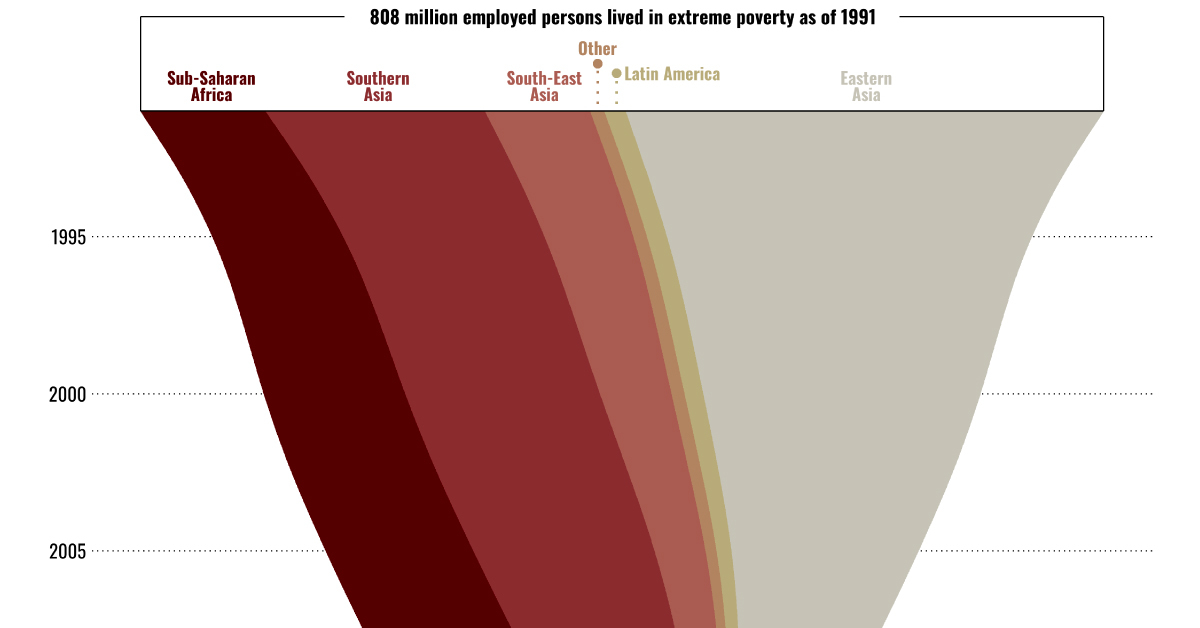
In 1991, about 808 million employed people were living in extreme poverty, or nearly 15% of the global population at the time.
As the graphic above shows, a majority of this population lived in Eastern Asia, most notably in China, which was the world’s most populous country until only very recently.
However, thanks to China’s economic reforms, and political reforms like the National “8-7” Poverty Reduction Plan, millions of people in the country were lifted out of poverty.
Today, Sub-Saharan Africa is the region with the world’s highest concentration of working poor. Below, we’ll take a closer look at the region and zoom in on select countries.
Zooming in on Sub-Saharan Africa
As of 2021, 11 of the 49 countries that make up Sub-Saharan Africa had a working poverty rate that made up over half their population.
Here’s a look at these 11 countries, and the percentage of their working population that lives in extreme poverty:
| Rank | Country | Working Poverty Rate (% of total population) |
|---|---|---|
| 1 | 🇧🇮 Burundi | 79% |
| 2 | 🇲🇬 Madagascar | 76% |
| 3 | 🇨🇩 DR Condo | 69% |
| 4 | 🇲🇼 Malawi | 65% |
| 5 | 🇨🇫 Central African Republic | 63% |
| 6 | 🇬🇼 Guinea-Bissau | 61% |
| 7 | 🇲🇿 Mozambique | 61% |
| 8 | 🇨🇬 Congo | 59% |
| 9 | 🇿🇲 Zambia | 56% |
| 10 | 🇦🇴 Angola | 52% |
| 11 | 🇱🇷 Liberia | 51% |
Burundi is first on the list, with 79% of its working population living below the poverty line. One reason for this is the country’s struggling economy—Burundi has the lowest GDP per capita of any country in the world.
Because of the economic conditions in the country, many people struggle to meet their basic needs. For instance, it’s estimated that 40% of urban dwellers in Burundi don’t have access to safe drinking water.
But Burundi is not alone, with other countries like Madagascar and the Democratic Republic of the Congo also having more than two-thirds of their working population in extreme poverty. Which countries will be able to able to lift their people out of poverty next?

This article was published as a part of Visual Capitalist's Creator Program, which features data-driven visuals from some of our favorite Creators around the world.


Demographics
The Countries That Have Become Sadder Since 2010
Tracking Gallup survey data for more than a decade reveals some countries are witnessing big happiness declines, reflecting their shifting socio-economic conditions.


The Countries That Have Become Sadder Since 2010
This was originally posted on our Voronoi app. Download the app for free on iOS or Android and discover incredible data-driven charts from a variety of trusted sources.
Can happiness be quantified?
Some approaches that try to answer this question make a distinction between two differing components of happiness: a daily experience part, and a more general life evaluation (which includes how people think about their life as a whole).
The World Happiness Report—first launched in 2012—has been making a serious go at quantifying happiness, by examining Gallup poll data that asks respondents in nearly every country to evaluate their life on a 0–10 scale. From this they extrapolate a single “happiness score” out of 10 to compare how happy (or unhappy) countries are.
More than a decade later, the 2024 World Happiness Report continues the mission. Its latest findings also include how some countries have become sadder in the intervening years.
Which Countries Have Become Unhappier Since 2010?
Afghanistan is the unhappiest country in the world right now, and is also 60% unhappier than over a decade ago, indicating how much life has worsened since 2010.
In 2021, the Taliban officially returned to power in Afghanistan, after nearly two decades of American occupation in the country. The Islamic fundamentalist group has made life harder, especially for women, who are restricted from pursuing higher education, travel, and work.
On a broader scale, the Afghan economy has suffered post-Taliban takeover, with various consequent effects: mass unemployment, a drop in income, malnutrition, and a crumbling healthcare system.
| Rank | Country | Happiness Score Loss (2010–24) | 2024 Happiness Score (out of 10) |
|---|---|---|---|
| 1 | 🇦🇫 Afghanistan | -2.6 | 1.7 |
| 2 | 🇱🇧 Lebanon | -2.3 | 2.7 |
| 3 | 🇯🇴 Jordan | -1.5 | 4.2 |
| 4 | 🇻🇪 Venezuela | -1.3 | 5.6 |
| 5 | 🇲🇼 Malawi | -1.2 | 3.4 |
| 6 | 🇿🇲 Zambia | -1.2 | 3.5 |
| 7 | 🇧🇼 Botswana | -1.2 | 3.4 |
| 8 | 🇾🇪 Yemen | -1.0 | 3.6 |
| 9 | 🇪🇬 Egypt | -1.0 | 4.0 |
| 10 | 🇮🇳 India | -0.9 | 4.1 |
| 11 | 🇧🇩 Bangladesh | -0.9 | 3.9 |
| 12 | 🇨🇩 DRC | -0.7 | 3.3 |
| 13 | 🇹🇳 Tunisia | -0.7 | 4.4 |
| 14 | 🇨🇦 Canada | -0.6 | 6.9 |
| 15 | 🇺🇸 U.S. | -0.6 | 6.7 |
| 16 | 🇨🇴 Colombia | -0.5 | 5.7 |
| 17 | 🇵🇦 Panama | -0.5 | 6.4 |
| 18 | 🇵🇰 Pakistan | -0.5 | 4.7 |
| 19 | 🇿🇼 Zimbabwe | -0.5 | 3.3 |
| 20 | 🇮🇪 Ireland | -0.5 | 6.8 |
| N/A | 🌍 World | +0.1 | 5.5 |
Nine countries in total saw their happiness score drop by a full point or more, on the 0–10 scale.
Noticeably, many of them have seen years of social and economic upheaval. Lebanon, for example, has been grappling with decades of corruption, and a severe liquidity crisis since 2019 that has resulted in a banking system collapse, sending poverty levels skyrocketing.
In Jordan, unprecedented population growth—from refugees leaving Iraq and Syria—has aggravated unemployment rates. A somewhat abrupt change in the line of succession has also raised concerns about political stability in the country.

-

 Energy1 week ago
The World’s Biggest Nuclear Energy Producers
-

 Money2 weeks ago
Which States Have the Highest Minimum Wage in America?
-

 Technology2 weeks ago
Ranked: Semiconductor Companies by Industry Revenue Share
-

 Markets2 weeks ago
Ranked: The World’s Top Flight Routes, by Revenue
-

 Countries2 weeks ago
Population Projections: The World’s 6 Largest Countries in 2075
-

 Markets2 weeks ago
The Top 10 States by Real GDP Growth in 2023
-

 Demographics2 weeks ago
The Smallest Gender Wage Gaps in OECD Countries
-

 United States2 weeks ago
Where U.S. Inflation Hit the Hardest in March 2024