Money
How COVID-19 Has Impacted Black-White Financial Inequality

How COVID-19 Impacted Black-White Financial Inequality
COVID-19 has disrupted everything from economic markets to personal finances, but not everyone feels its effects equally. When compared with White Americans, Black Americans’ financial situations have been disproportionately affected by the pandemic.
In this infographic from McKinsey & Co., we outline the financial vulnerabilities of Black Americans, their increased usage of financial services since the onset of the pandemic, and their lower satisfaction levels with those services.
Financial Vulnerabilities of Black Americans
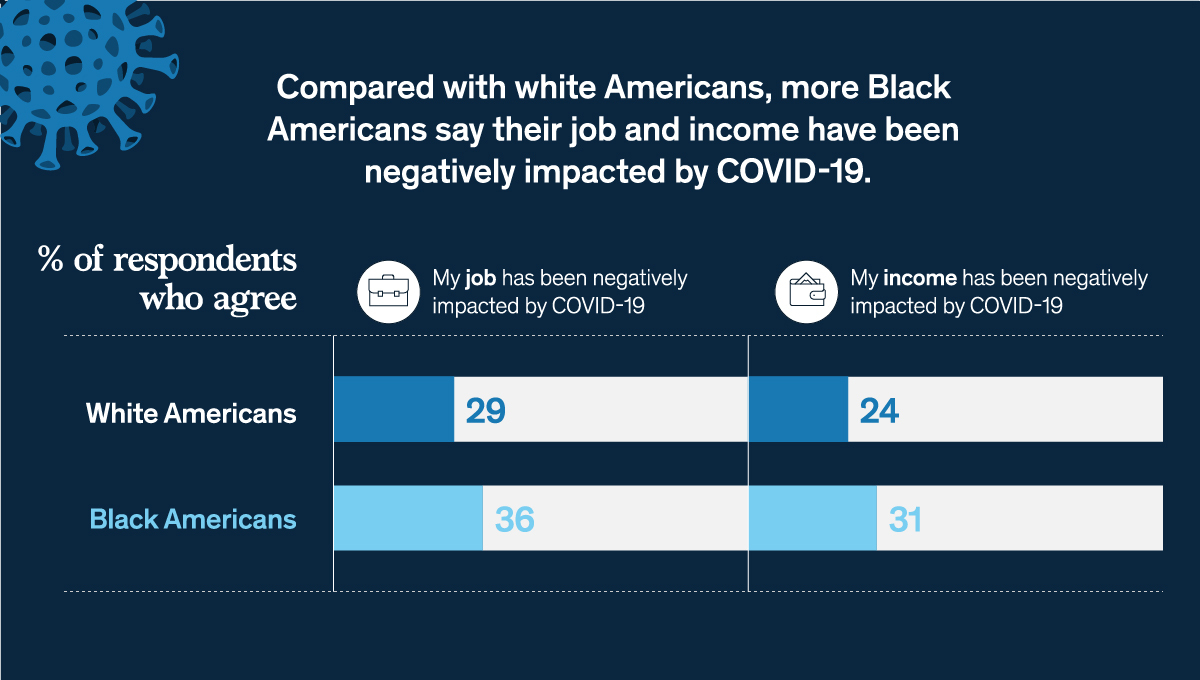
Compared to White Americans, more Black Americans say their job and income have been negatively impacted by COVID-19.
| My job has been negatively impacted by COVID-19 | My income has been negatively impacted by COVID-19 | |
|---|---|---|
| White Americans | 29% | 24% |
| Black Americans | 36% | 31% |
Looking forward, Black Americans also report greater job security concerns and have less savings to protect themselves financially. In the event of a job loss, 57% of Black Americans report their savings would last four months or less, compared with 44% of White Americans.
With less of a cash buffer on hand, Black consumers are also more likely to have missed a recent bill payment.
| Skipped at least 1 payment | Partially paid at least 1 bill | Paid in full | |
|---|---|---|---|
| White Americans | 16% | 22% | 62% |
| Black Americans | 51% | 22% | 27% |
This includes being unable to pay for basic items such as utilities, telephone and internet, and mortgage payments.
How do they begin to manage these challenges?
Use of Financial Services
Black Americans increased their use of financial services more than White Americans.
Banking activities in the past two weeks, per March-June 2020 surveys
| Withdrew cash | Deposited cash | Deposited checks | Contacted bank for service on account | Opened new accounts | Received advice on digital tool usage | |
|---|---|---|---|---|---|---|
| White Americans | 35% | 20% | 40% | 9% | 3% | 4% |
| Black Americans | 47% | 31% | 30% | 15% | 7% | 7% |
For example, Black Americans were about twice as likely to request account service, open an account, or receive advice on digital tools. In addition, Black families were more likely to leverage a fintech platform and have been more active in opening fintech accounts since the start of the COVID-19 crisis.
However, as Black Americans seek out more financial help, some are not happy with the service they receive.
Satisfaction with Financial Services
Overall, Black families are less satisfied than White families across all types of financial activities. These differences were most pronounced for digital tool advice, where 38% of Black Americans were dissatisfied or very dissatisfied, compared with just 12% of White Americans.
Even though Black people were less satisfied with banking services, they were more likely to say that bank performance was above their expectations. This may suggest that expectations are lower for Black families than they are for White families.
Black Americans were also much less likely to trust their financial advisor.
| Do not trust/losing trust | Indifferent | Gaining trust/trust | |
|---|---|---|---|
| White Americans | 10% | 9% | 81% |
| Black Americans | 32% | 9% | 59% |
From March-June 2020, the percentage of Black people distrusting their advisors rose from 12% to 32%. Over the same time period, White people’s distrust of financial advisors remained stable at 10%.
A notable exception: White and Black Americans were both satisfied with fintech providers. Only 5% of White Americans and 8% of Black Americans expressed some level of dissatisfaction with fintech companies.
Time to Examine the Financial System?
COVID-19 has perpetuated Black-White financial inequality. Data shows that Black families are more likely to be financially vulnerable, and increase their use of financial services during the COVID-19 crisis. However, they are less likely to feel satisfied with these services.
Financial institutions can urgently review their remote and in-person customer service procedures to ensure the needs of all families are being met.
Money
Charted: Which City Has the Most Billionaires in 2024?
Just two countries account for half of the top 20 cities with the most billionaires. And the majority of the other half are found in Asia.

Charted: Which Country Has the Most Billionaires in 2024?
This was originally posted on our Voronoi app. Download the app for free on iOS or Android and discover incredible data-driven charts from a variety of trusted sources.
Some cities seem to attract the rich. Take New York City for example, which has 340,000 high-net-worth residents with investable assets of more than $1 million.
But there’s a vast difference between being a millionaire and a billionaire. So where do the richest of them all live?
Using data from the Hurun Global Rich List 2024, we rank the top 20 cities with the highest number of billionaires in 2024.
A caveat to these rich lists: sources often vary on figures and exact rankings. For example, in last year’s reports, Forbes had New York as the city with the most billionaires, while the Hurun Global Rich List placed Beijing at the top spot.
Ranked: Top 20 Cities with the Most Billionaires in 2024
The Chinese economy’s doldrums over the course of the past year have affected its ultra-wealthy residents in key cities.
Beijing, the city with the most billionaires in 2023, has not only ceded its spot to New York, but has dropped to #4, overtaken by London and Mumbai.
| Rank | City | Billionaires | Rank Change YoY |
|---|---|---|---|
| 1 | 🇺🇸 New York | 119 | +1 |
| 2 | 🇬🇧 London | 97 | +3 |
| 3 | 🇮🇳 Mumbai | 92 | +4 |
| 4 | 🇨🇳 Beijing | 91 | -3 |
| 5 | 🇨🇳 Shanghai | 87 | -2 |
| 6 | 🇨🇳 Shenzhen | 84 | -2 |
| 7 | 🇭🇰 Hong Kong | 65 | -1 |
| 8 | 🇷🇺 Moscow | 59 | No Change |
| 9 | 🇮🇳 New Delhi | 57 | +6 |
| 10 | 🇺🇸 San Francisco | 52 | No Change |
| 11 | 🇹🇭 Bangkok | 49 | +2 |
| 12 | 🇹🇼 Taipei | 45 | +2 |
| 13 | 🇫🇷 Paris | 44 | -2 |
| 14 | 🇨🇳 Hangzhou | 43 | -5 |
| 15 | 🇸🇬 Singapore | 42 | New to Top 20 |
| 16 | 🇨🇳 Guangzhou | 39 | -4 |
| 17T | 🇮🇩 Jakarta | 37 | +1 |
| 17T | 🇧🇷 Sao Paulo | 37 | No Change |
| 19T | 🇺🇸 Los Angeles | 31 | No Change |
| 19T | 🇰🇷 Seoul | 31 | -3 |
In fact all Chinese cities on the top 20 list have lost billionaires between 2023–24. Consequently, they’ve all lost ranking spots as well, with Hangzhou seeing the biggest slide (-5) in the top 20.
Where China lost, all other Asian cities—except Seoul—in the top 20 have gained ranks. Indian cities lead the way, with New Delhi (+6) and Mumbai (+3) having climbed the most.
At a country level, China and the U.S combine to make up half of the cities in the top 20. They are also home to about half of the world’s 3,200 billionaire population.
In other news of note: Hurun officially counts Taylor Swift as a billionaire, estimating her net worth at $1.2 billion.
-

 Science1 week ago
Visualizing the Average Lifespans of Mammals
-

 Demographics2 weeks ago
The Smallest Gender Wage Gaps in OECD Countries
-

 United States2 weeks ago
Where U.S. Inflation Hit the Hardest in March 2024
-

 Green2 weeks ago
Top Countries By Forest Growth Since 2001
-

 United States2 weeks ago
Ranked: The Largest U.S. Corporations by Number of Employees
-

 Maps2 weeks ago
The Largest Earthquakes in the New York Area (1970-2024)
-

 Green2 weeks ago
Ranked: The Countries With the Most Air Pollution in 2023
-

 Green2 weeks ago
Ranking the Top 15 Countries by Carbon Tax Revenue

